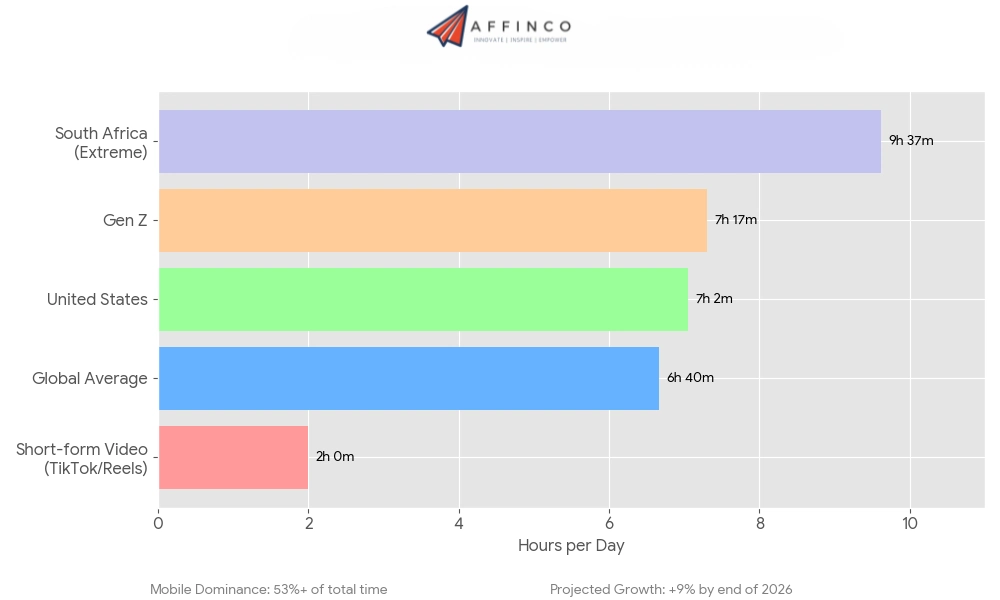
Your eyes are locked on glowing rectangles for 6 hours and 40 minutes every single day. That's not a guess but the hard truth behind Average Screen Time Statistics in 2026.
From scrolling through social media feeds to binge-watching streaming platforms, screens now consume over 40% of our waking hours.
This isn't just about mobile devices and laptops anymore; smart TVs, tablets, and emerging AR/VR headsets are adding fuel to our digital obsession.
We've researched and collected the latest smartphone addiction statistics, mental health impacts, generational breakdowns, and country rankings to give you a complete picture of how humanity is spending its attention in 2026.
Top Screen Time Statistics for 2026
Global Average Screen Time Statistics (2026)
The global baseline for digital consumption has stabilized at a historically high level, driven by mobile adoption in emerging markets and the integration of AI tools in daily workflows.
Key Insight: While the raw hours have plateaued in some developed nations, the intensity of usage is rising due to multitasking across multiple devices.
Screen Time by Country: The 2026 Rankings
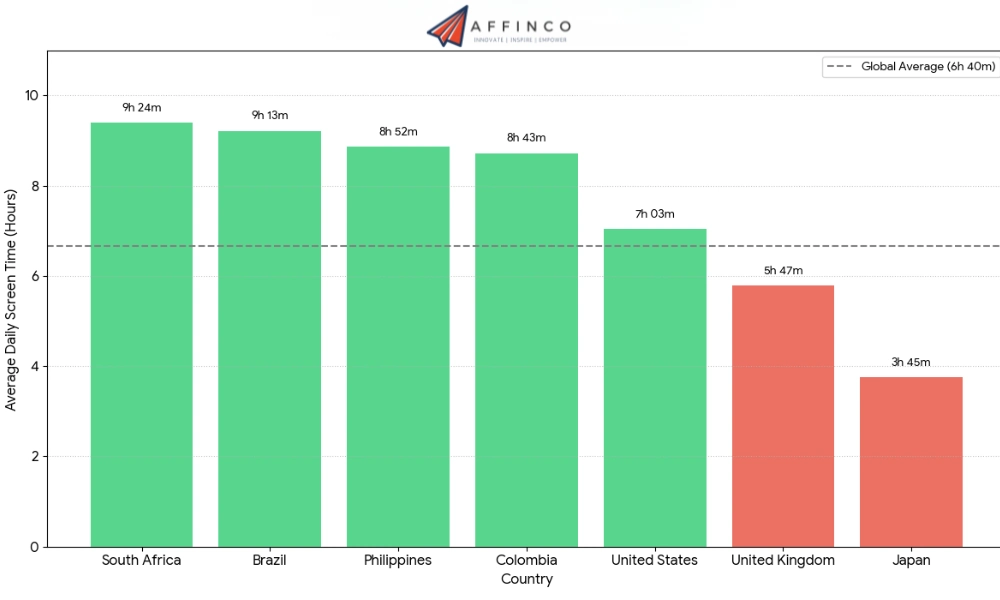
Geographic location is the single biggest predictor of digital habits, with emerging markets showing significantly higher engagement levels than established economies. Nations with younger populations and “mobile-first” infrastructure consistently top the usage charts.
| Rank | Country | Average Daily Screen Time | Deviation from Global Avg |
|---|---|---|---|
| 1 | South Africa | 9 hours 24 mins | +2h 44m |
| 2 | Brazil | 9 hours 13 mins | +2h 33m |
| 3 | Philippines | 8 hours 52 mins | +2h 12m |
| 4 | Colombia | 8 hours 43 mins | +2h 03m |
| 5 | United States | 7 hours 03 mins | +23m |
| 6 | United Kingdom | 5 hours 47 mins | -53m |
| 7 | Japan | 3 hours 45 mins | -2h 55m |
South Africa continues to lead the world in digital connectivity duration. Conversely, Japan’s low usage highlights a cultural distinction where offline efficiency is prioritized over digital leisure.
Generation Z: The Heavy Users
Born into a fully connected world, Generation Z exhibits the highest rates of device dependency and daily usage. Their screen time is not just for entertainment but serves as their primary mode of socialization and identity formation.
Gen Z clocks in at approximately 7 hours 18 minutes per day on screens.
This generation does not view online and offline as separate states. Their high usage reflects a lifestyle where digital connection is a prerequisite for social participation.
Mobile Phone Usage Statistics
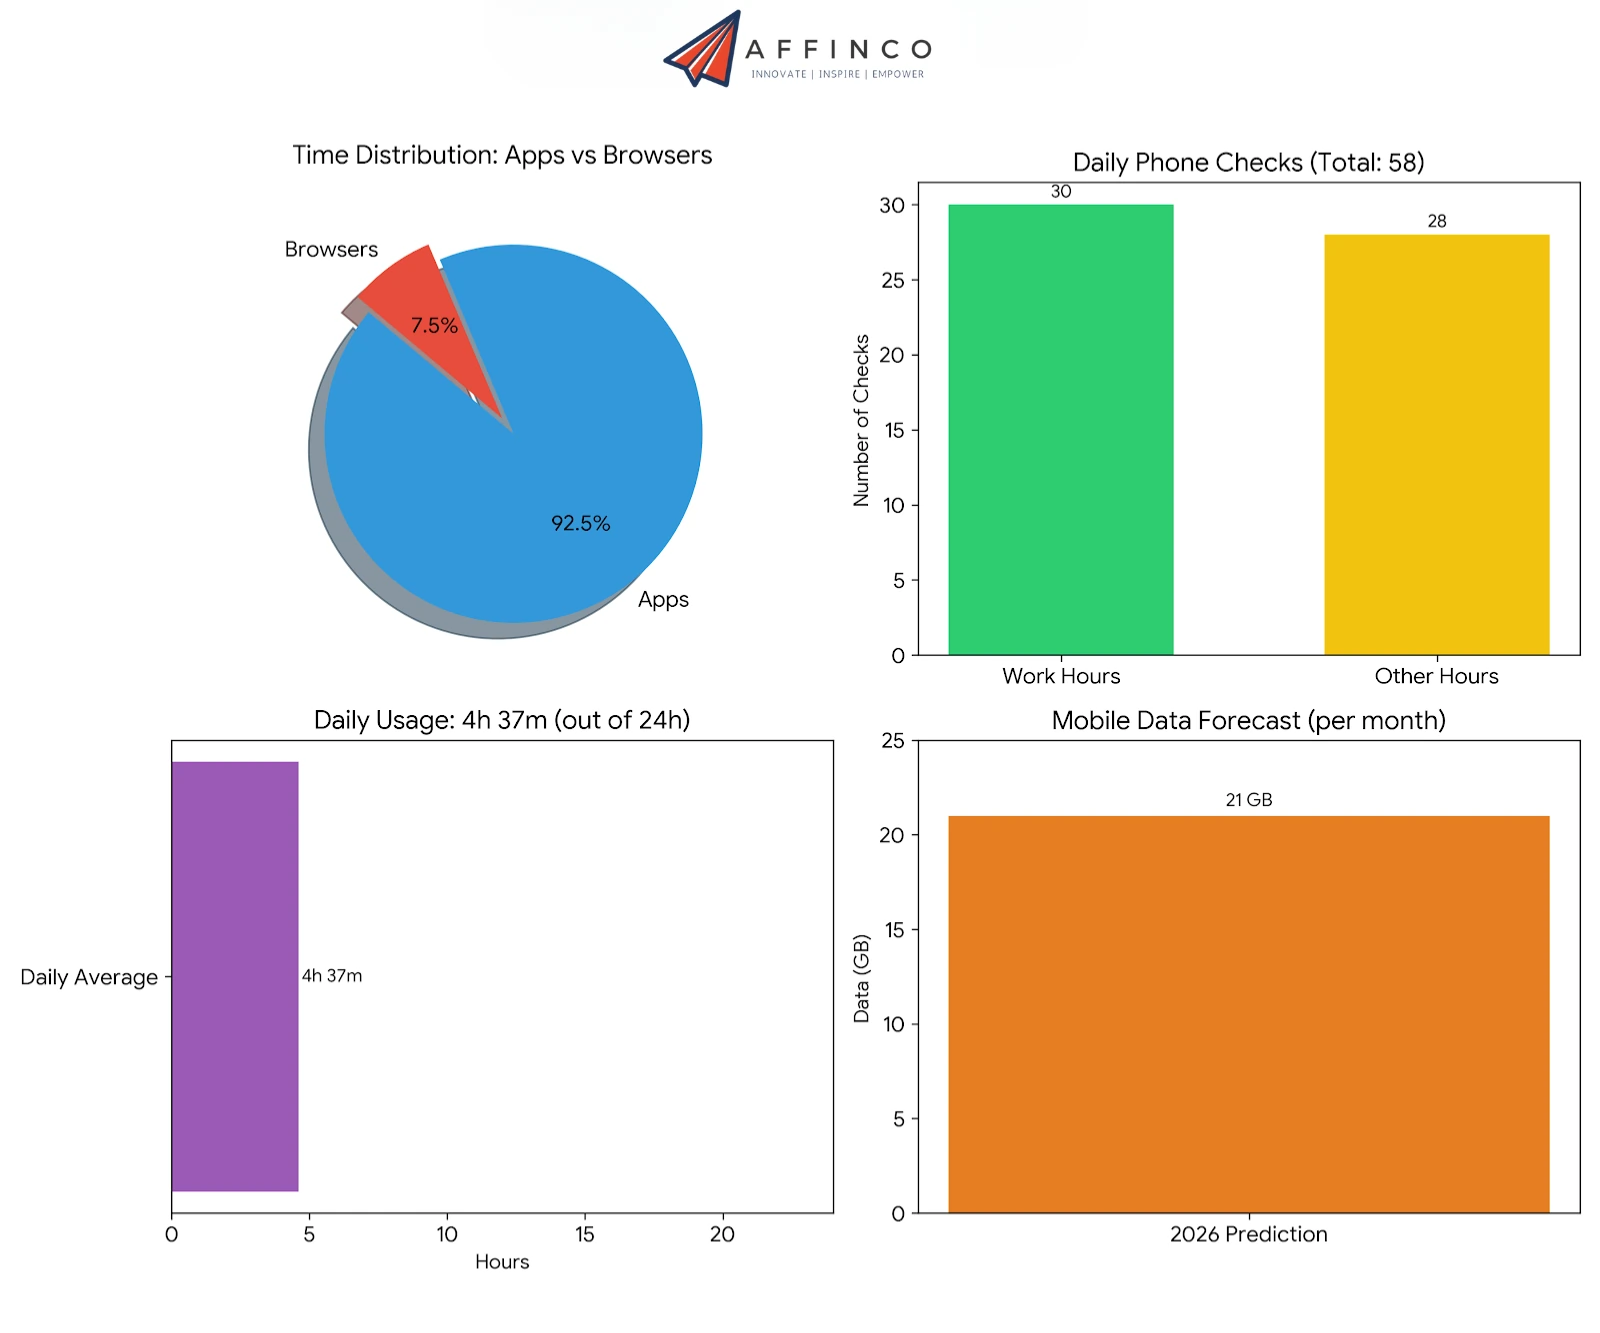
The smartphone is the undisputed king of screens, absorbing the majority of our digital attention. It has cannibalized cameras, navigation, banking, and social interaction into a single glowing rectangle.
We are no longer “going online”; we live online through our phones. This tethering makes the mobile device the most valuable real estate for advertisers in 2026.
Social Media Screen Time
Social platforms are engineered to capture attention, and they are succeeding with ruthless efficiency. The rise of short-form video has created a feedback loop that keeps users scrolling longer.
- Users spend 2 hours and 20 minutes per day specifically on social media platforms.
- At current rates, the average person will spend 5 years and 4 months of their life on social media.
- TikTok (and its local variants) commands the highest engagement, with users averaging 95 minutes daily on the app.
- 60% of all social media time is now spent watching video content rather than reading text or viewing static images.
- The average user maintains accounts on 6.7 different social networks, fragmenting their attention across multiple feeds.
Social media is the primary driver of non-productive screen time. The shift to algorithmic feeds ensures that users are served content they didn't explicitly ask for but cannot look away from.
Streaming vs. Linear TV Statistics
The battle for the living room has largely been won by on-demand streaming services. Linear TV is declining rapidly, surviving mostly on live sports and news broadcasts.
Viewers now expect control over their programming schedule. The “prime time” slot is dead; every hour is now prime time for someone, somewhere.
Workplace Screen Time & Remote Work
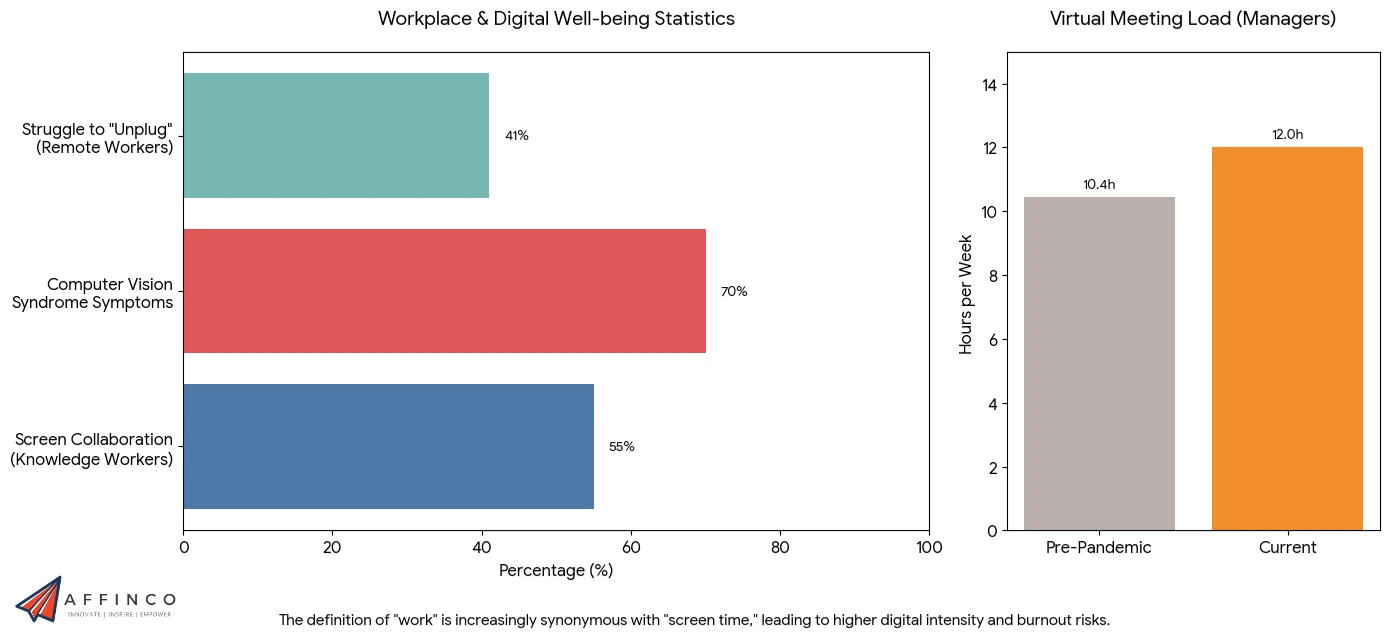
The definition of “work” has become synonymous with “screen time” for knowledge workers. The persistence of hybrid models keeps digital communication tools at the center of professional life.
- Workday Screens: Knowledge workers spend 55% of their workday collaborating on screens via email, Slack, or Zoom.
- Meeting Fatigue: Time spent in virtual meetings averages 12 hours per week for managers, a 15% increase from pre-pandemic levels.
- Productivity Tools: The use of AI productivity assistants is expected to add frequent, short-burst screen interactions to the workday.
- Digital Eye Strain: 70% of office workers report symptoms of Computer Vision Syndrome due to prolonged exposure.
- Disconnect Issues: 41% of remote workers struggle to “unplug” after work, leading to longer total daily screen hours.
Workplace screen time is unavoidable but increasingly exhausting. Organizations are beginning to measure “digital intensity” as a risk factor for employee burnout.
2026 Predictions: AR, VR, and The Metaverse
As hardware evolves, screen time is moving from 2D rectangles to 3D immersive environments. This shift will likely increase total engagement time rather than reduce it.
We are on the cusp of a hardware transition. Just as smartphones replaced PCs, spatial computing may eventually replace the phone, making “screen time” a metric of the past.
The Rise of AI and Screen Time
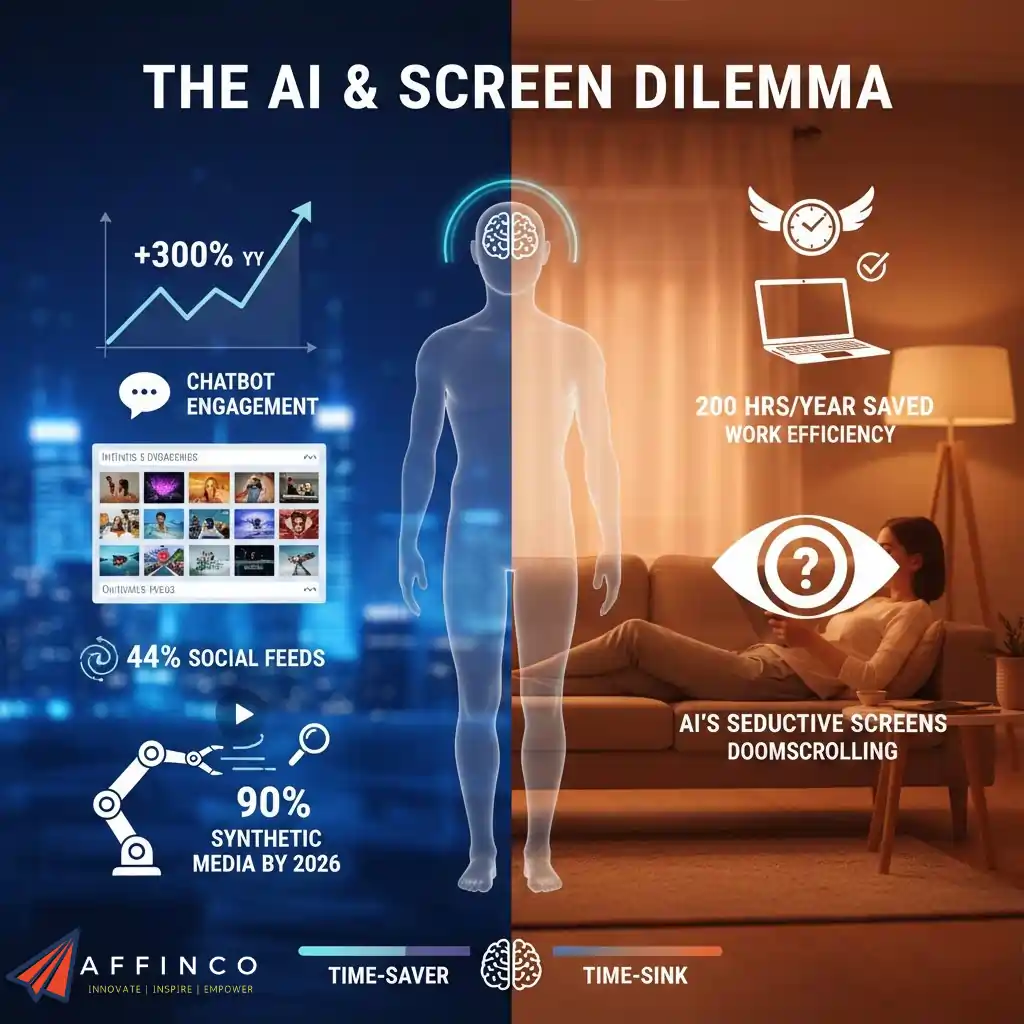
Artificial Intelligence is the new variable in the screen time equation. It acts as both a time-saver and a time-sink, automating tasks while generating endless content.
AI is making screens more seductive. Algorithms that understand individual preferences better than the user does are the primary driver of the doomscrolling phenomenon.
Health Impacts: Mental Well-being
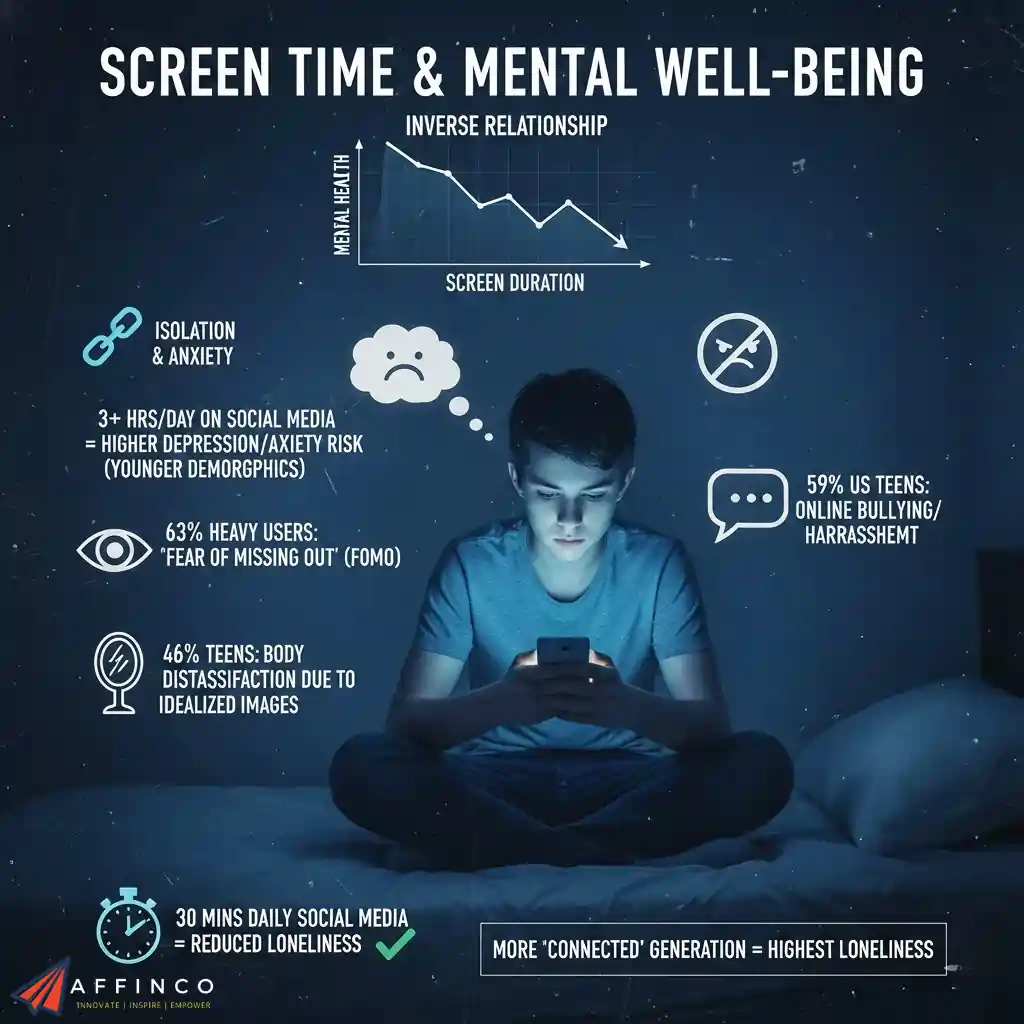
While screens connect us, they also foster isolation and anxiety. The data shows a disturbing link between heavy usage and declining mental health, particularly among younger demographics.
Mental health in the digital age is inversely related to screen duration. The most “connected” generation is ironically reporting the highest levels of loneliness.
Economic Impact of Screen Time
Time is money, and the digital economy thrives on capturing human attention. The screen time economy is a multi-trillion dollar engine driving global commerce.
Our attention is the product. Every minute of screen time is monetized, whether through direct sales, data collection, or ad impressions.
Digital Detox and Pushback Trends
A counter-movement is gaining momentum as users recognize the toll of hyper-connectivity. “Digital minimalism” is transitioning from a niche lifestyle to a mainstream wellness goal.
The desire to disconnect is becoming a status symbol. Being “unreachable” is the new luxury in a world of constant notification.
Gaming Screen Time Statistics
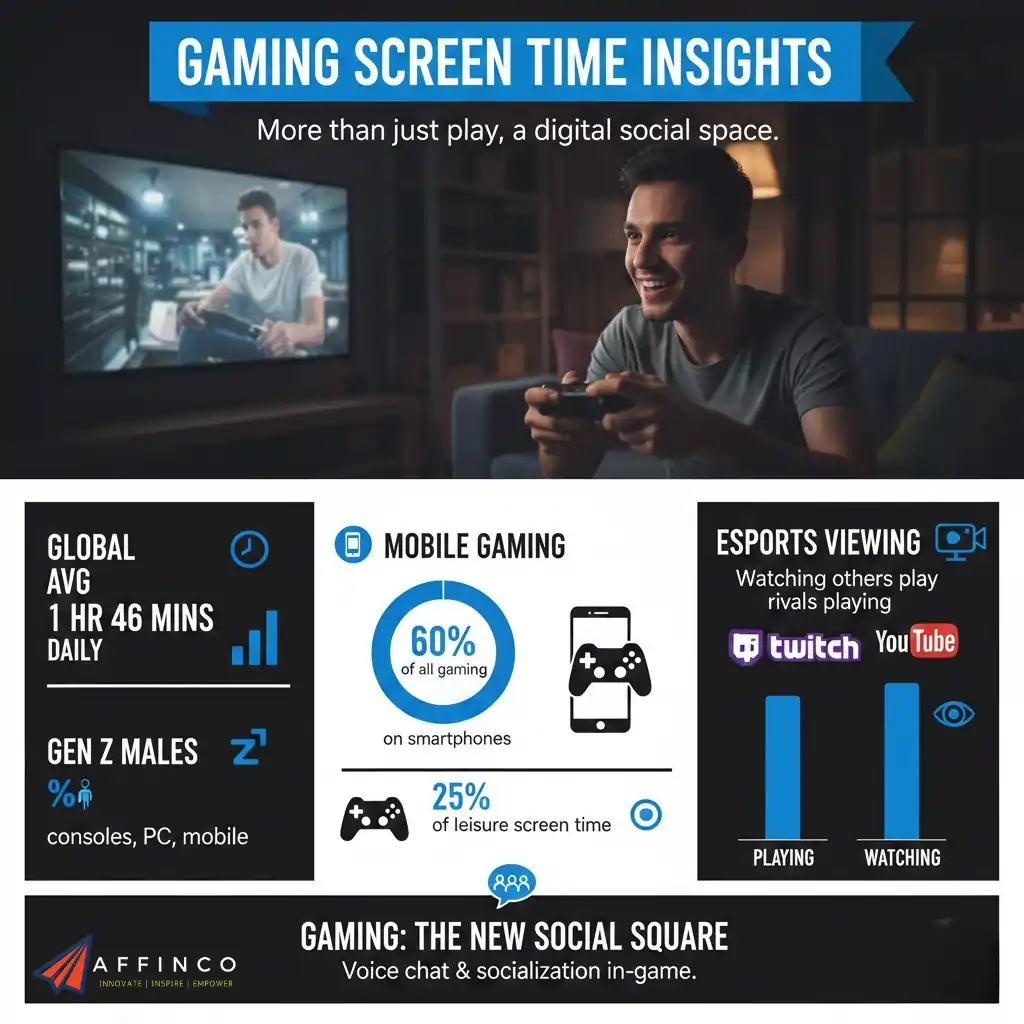
Gaming is a massive component of screen time, particularly for younger men. It differs from social media in that it requires active, intense focus rather than passive scrolling.
Gaming is evolving into a social square. For many, the “game” is just a background activity for voice chat and socialization.
Conclusion: The Future of Our Attention
As we look toward 2026, the data indicates that average screen time has stabilized at a high level, becoming a permanent fixture of modern existence. The challenge for the next decade is not eliminating screens, but improving the quality of the time spent on them.
With AI integration and immersive tech on the horizon, our relationship with digital devices is set to become even more intimate. The key for individuals will be intentionality—ensuring that we use screens as tools for creation and connection, rather than allowing them to use us for passive consumption.
Final Thought: If you spend the global average of 6 hours and 40 minutes on a screen today, you will have spent nearly 30% of your year in a digital world. Make those hours count.

Ali
Ali is a digital marketing expert with 7+ years of experience in SEO-optimized blogging. Skilled in reviewing SaaS tools, social media marketing, and email campaigns, we craft content that ranks well and engages audiences. Known for providing genuine information, Ali is a reliable source for businesses seeking to boost their online presence effectively.