No platform comes close to Google Ads when it comes to paid advertising. In 2026, Google is projected to generate over $318 billion in advertising revenue, making it the single largest ad-selling company on the planet.
With 16.4 billion searches happening every single day and ads reaching 90% of internet users worldwide, Google Ads remains the backbone of pay-per-click advertising for millions of businesses.
For marketers planning budgets, optimising campaigns, or pitching clients, having accurate benchmarks is not optional. It is essential.
This article covers verified Google Ads stats for 2026, from average cost per click and conversion rates to YouTube ad revenue and AI-driven automation trends. Every number is sourced from trusted data providers and updated for 2026.
Quick-Fire Google Ads Facts for 2026 ⚡
📺 Google Ads Revenue and Market Size in 2026
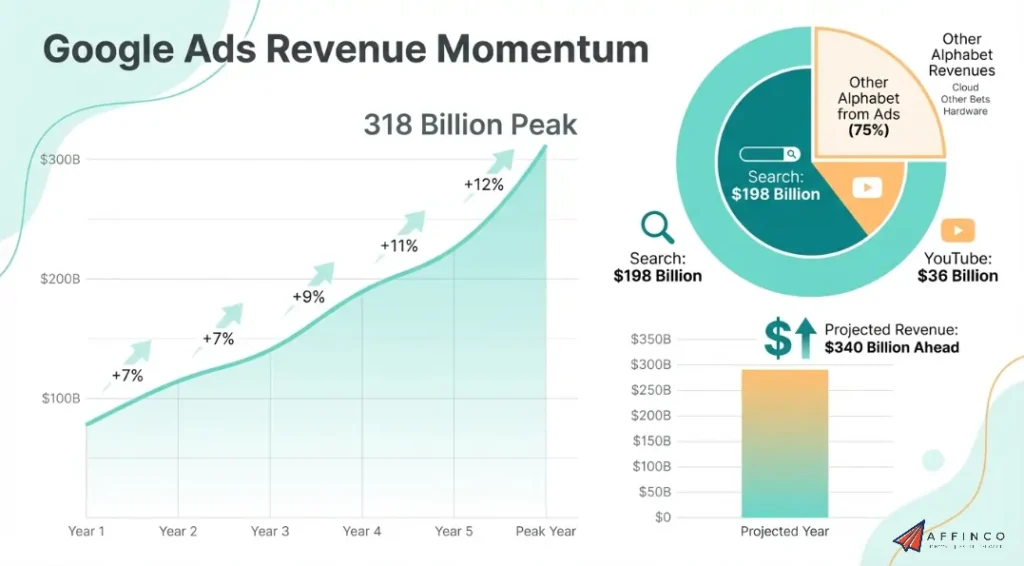
Google's parent company Alphabet reported $348.16 billion in total revenue for 2024. Out of that, $264.59 billion came purely from advertising. In 2025, full-year revenue climbed further with net income reaching $132 billion.
For 2026, projections place Google advertising revenue at approximately $318 billion, continuing a growth rate of 7 to 10% year over year.
| Year | Google Ad Revenue (USD Billion) | YoY Growth |
|---|---|---|
| 2022 | 224.47 | -3.6% |
| 2023 | 237.86 | 6.0% |
| 2024 | 264.59 | 11.2% |
| 2025 | 296.00 (estimated) | 11.9% |
| 2026 | 318.00 (projected) | 7.4% |
| 2027 | 340.00 (projected) | 6.9% |
74.71% of Alphabet's total income comes from advertising activities. Advertising is not just a segment for Google. It is practically the entire business model. Search ads alone contributed $198.08 billion, while YouTube added $36.15 billion.
Google Ads Global Market Share and Reach 🌍
Google dominates digital advertising market share by a wide margin. No competitor comes close to matching its reach or volume.
Google's dominance is built on one simple fact. Almost eight out of every ten online searches happen on Google. That kind of search volume creates an unmatched advertising reach that no other platform can replicate.
💰 Average CPC by Industry in 2026
Cost per click is the metric most advertisers watch closely. It varies enormously depending on industry, competition level and keyword intent.
| Industry | Average CPC (USD) | Competition Level |
|---|---|---|
| Insurance | $16.54 | Very High |
| Legal | $8.67 | Very High |
| Finance & Banking | $5.10 | High |
| SaaS & Software | $4.00 – $15.00 | High |
| Healthcare | $3.50 – $6.00 | High |
| Real Estate | $2.81 | Medium |
| Retail / eCommerce | $1.00 – $3.00 | Medium |
| Travel & Hospitality | $1.53 | Medium |
| Electronics | $0.75 | Low |
In the UK, average CPC across all industries sits at £1.95 for Search and £0.48 for Display. Google Shopping Ads come in at just $0.66 per click, making them one of the most affordable ad formats for eCommerce brands.
The insurance industry remains the most expensive vertical at $16.54 per click. Electronics sits at the opposite end at just $0.75. That is a 22x difference between the cheapest and most expensive industries.
📈 Click-Through Rate Benchmarks Across Ad Types
Click-through rates tell you how well ads grab attention. Higher CTR means better ad relevance and usually lower costs.
| Ad Format | Average CTR | Average CPC |
|---|---|---|
| Search Ads | 3.17% – 4.7% | $2.69 – $4.22 |
| Display Ads | 0.46% – 0.58% | $0.48 – $0.63 |
| Shopping Ads | 0.86% | $0.66 |
| YouTube Ads | 0.65% | $0.026 CPV |
Search ads consistently outperform every other format in CTR. Display ads hover around 0.46% to 0.58%, but they compensate with massive reach and low cost.
Industry-specific CTR data shows some interesting patterns:
High-CPC industries like Legal tend to have lower CTRs. Competition is fierce and searchers are more selective with clicks. If your CTR falls below industry average, focus on ad copy testing and ad extensions to close the gap.
🔥 Google Ads Conversion Rate Stats for 2026
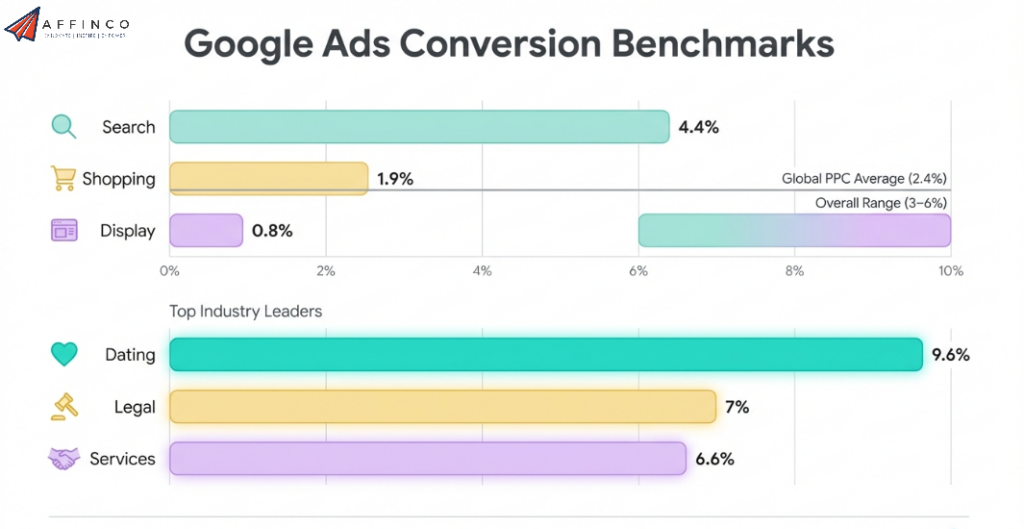
Clicks matter. But conversions pay the bills. Google Ads conversion rates vary greatly by ad type, industry and campaign objective.
Google Ads outperforms the global PPC average quite comfortably. Industries with the highest search ad conversion rates include:
Home services leads conversion benchmarks as well because searchers often have urgent needs like a broken boiler or leaking roof. eCommerce sits lower because browsing behaviour is more common among shoppers.
💵 Google Ads ROI and Revenue Performance
Return on investment is why businesses keep spending billions on Google Ads every year. Numbers prove it works.
That 200% average ROI puts Google Ads well ahead of traditional marketing, which shows a global average of 140% ROI. For eCommerce specifically, heavy equipment and manufacturing sectors report ROAS as high as 690% and 540% respectively.
📱 Mobile Advertising Dominates Google Ads
Mobile is no longer the future of Google Ads traffic. It is the present.
59% of online shoppers say mobile ads help them decide which brands to buy from. If your landing pages are not optimised for mobile, you are losing more than half of your potential conversions.
🎬 YouTube Advertising Revenue and Benchmarks
YouTube is the second biggest contributor to Google's ad revenue. YouTube advertising is growing faster than search in percentage terms.
Shorter ads under 15 seconds see higher completion rates. For marketers running video ad campaigns, concise and engaging messaging matters more than production quality.
🛒 Google Shopping and eCommerce Campaign Stats
Google Shopping Ads are the most cost-effective format for retail advertisers. They dominate eCommerce advertising by a huge margin.
At $0.66 per click, Shopping Ads cost significantly less than Facebook Ads ($0.97 to $1.00), Instagram Ads ($1.01 to $1.20), and TikTok Ads (over $1.00). For eCommerce brands with tight margins, Shopping Ads offer the best cost per acquisition ratio.
🤖 AI and Automation in Google Ads 2026
Artificial intelligence now powers most of what happens inside Google Ads. Manual campaign management is becoming a thing of the past.
Google itself reports that over 50% of revenue now comes from automated bidding campaigns. AI does not just assist with bids. It writes ad copy, tests creatives, and adjusts targeting in real time.
🖥️ Google Display Network Performance Stats
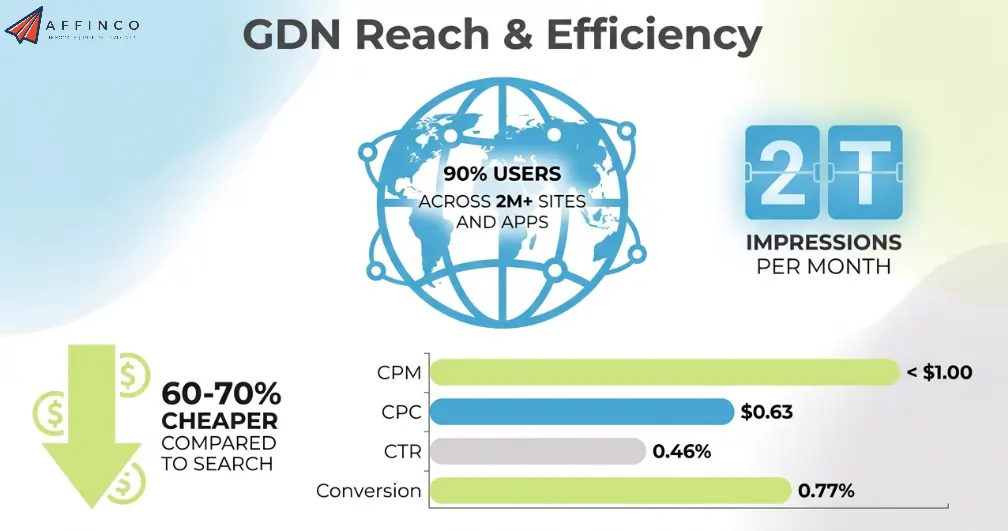
Google Display Network offers the cheapest ad impressions across any Google property. It is built for awareness and retargeting rather than direct conversions.
Display campaigns work best for brand awareness and remarketing. They convert at lower rates than search, but make up for it with massive volume and extremely low costs per impression.
👤 User Behaviour and How People Interact with Ads
Understanding why people click (or skip) ads helps build better campaigns.
Top reasons users click on paid ads:
🌏 Regional Breakdown of Google Ad Spend
Google Ads spending is not distributed evenly. Some regions spend far more per click than others.
For marketers running international campaigns, CPC variance by region is enormous. A keyword costing $5 in the US might cost $0.50 in Southeast Asia. Smart geo-targeting can dramatically improve advertising ROI without increasing budgets.
🧠 What Smart Marketers Should Do with This Data
Google Ads in 2026 is bigger, smarter and more automated than ever before. With $318 billion in projected revenue and 80% market share in PPC, no paid advertising strategy is complete without it.
Three things stand out from all of these numbers. First, mobile is everything. Over 63% of clicks and 95% of paid interactions come from smartphones. Second, AI adoption is not optional anymore.
Over 80% of campaigns run on automated bidding, and those who resist are paying more for worse results. Third, know your benchmarks. A $16.54 CPC in insurance versus $0.75 in electronics means every industry plays a completely different game.
Use these stats to set realistic targets, negotiate better budgets, and build campaigns that actually deliver. The data is clear. Google Ads is not slowing down anytime soon.

Ali
Ali is a digital marketing expert with 7+ years of experience in SEO-optimized blogging. Skilled in reviewing SaaS tools, social media marketing, and email campaigns, we craft content that ranks well and engages audiences. Known for providing genuine information, Ali is a reliable source for businesses seeking to boost their online presence effectively.