
The gaming industry has exploded to $522.46 billion in 2025, making it bigger than movies and music combined.
With 3.32 billion active players worldwide, video games now reach nearly half the planet's population. Mobile gaming alone captures 49% of total gaming revenue, while 95% of mobile app earnings come from in-app purchases.
Our team spent months collecting the latest Gaming Statistics from industry reports, company earnings, and market research. This data reveals surprising trends about gamer demographics, spending habits, and platform preferences.
From console wars to virtual reality adoption, these numbers show exactly how people play, pay, and engage with games today. Here's what the data actually tells us about gaming in 2025.
Global Gaming Market Overview
The video game market has reached extraordinary financial heights, establishing itself as the world's largest entertainment sector. Current market valuations show the industry's remarkable growth trajectory and future potential.
The global gaming market size stands at an impressive $522.46 billion in 2025, with analysts projecting continued expansion to exceed $691 billion by 2029.
Key global gaming revenue statistics include:
The gaming industry revenue has demonstrated remarkable resilience during economic uncertainties, with year-over-year growth maintaining positive momentum.
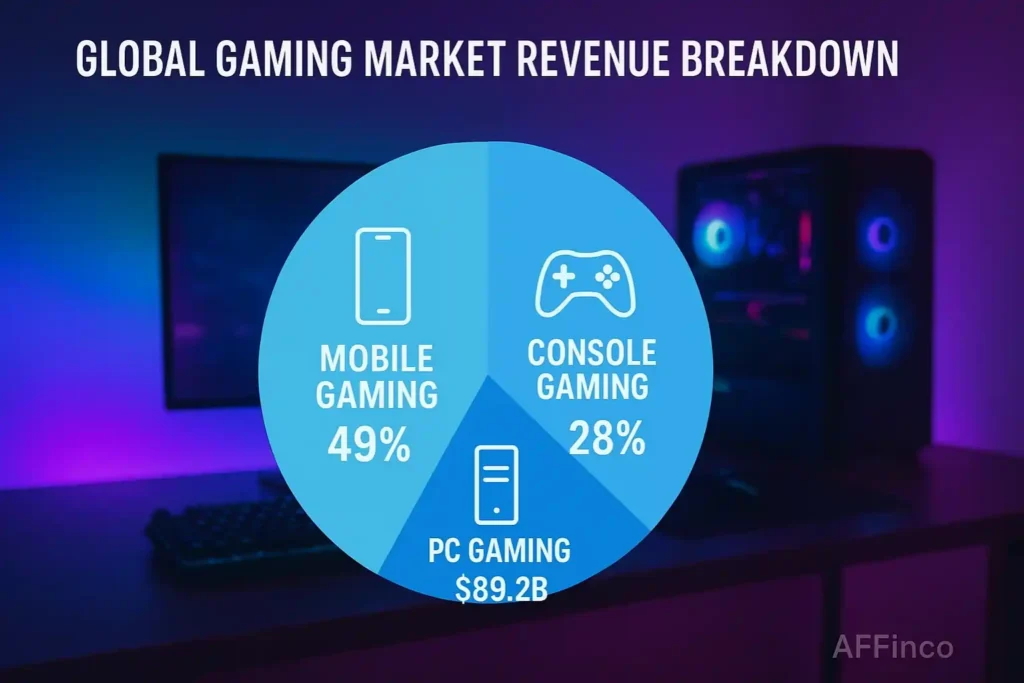
| Market Segment | 2025 Revenue | Market Share | Growth Rate |
|---|---|---|---|
| Mobile Gaming | $92 billion | 49% | +4% YoY |
| Console Gaming | $107.6 billion | 28% | +2.5% YoY |
| PC Gaming | $89.2 billion | 23% | +1.8% YoY |
Mobile gaming statistics particularly highlight the sector's shift toward accessible, smartphone-based entertainment that appeals to diverse demographics.
Player Demographics and Gaming Population
Understanding gamer demographics reveals how the gaming audience has expanded beyond traditional stereotypes. The current player base represents one of the most diverse entertainment audiences globally.
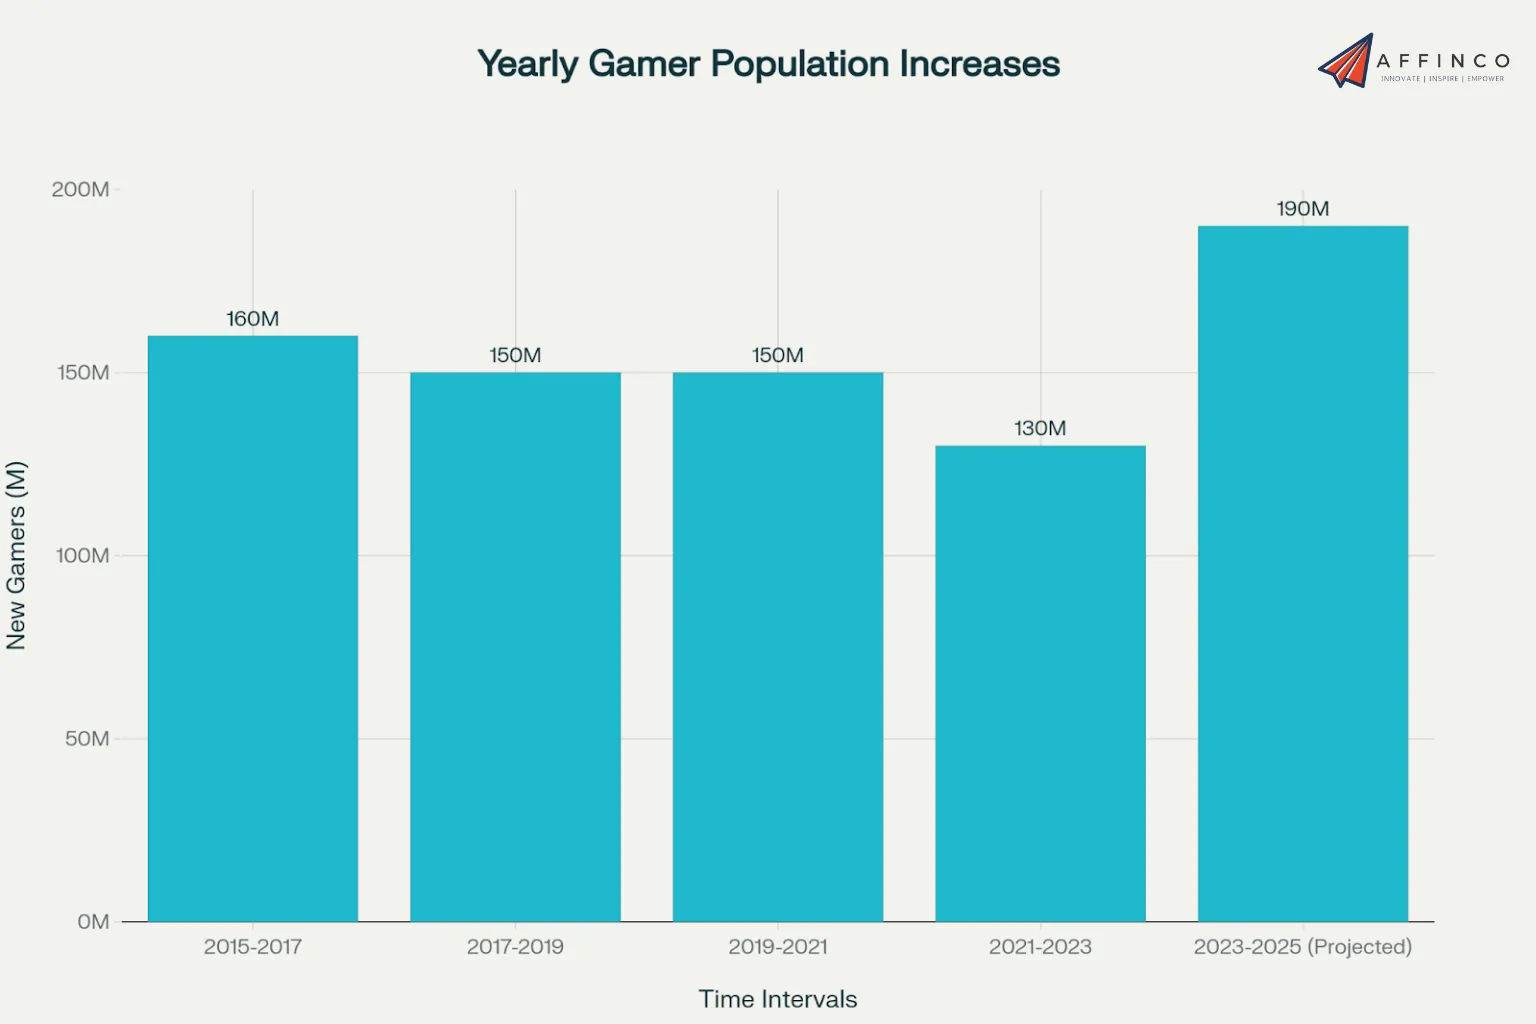
The total number of gamers worldwide has reached 3.32 billion active players, representing an increase of over 1 billion participants in the past nine years. This growth demonstrates gaming's mainstream adoption across age groups, genders, and geographical regions.
Gaming population growth trends:
Gender Distribution in Gaming
Gaming gender statistics show remarkable parity between male and female players, challenging outdated assumptions about the typical gamer profile.
This gender balance has evolved significantly over recent years, with female participation steadily increasing across all gaming platforms and genres.
Age Demographics and Gaming Habits
Gaming age statistics reveal that adult players represent the majority of the gaming market, contradicting assumptions about gaming being primarily a youth activity.
The average mobile gamer age is 36 years old, indicating significant purchasing power and engagement potential within the gaming community.
Age distribution breakdown:
| Age Group | Percentage | Gaming Preferences | Average Spending |
|---|---|---|---|
| 18-34 | 38% | Mobile, Console, PC | $85 annually |
| 35-44 | 14% | Mobile, Casual Games | $72 annually |
| 45+ | 28% | Mobile, Puzzle Games | $58 annually |
Mobile Gaming Dominance and Market Leadership
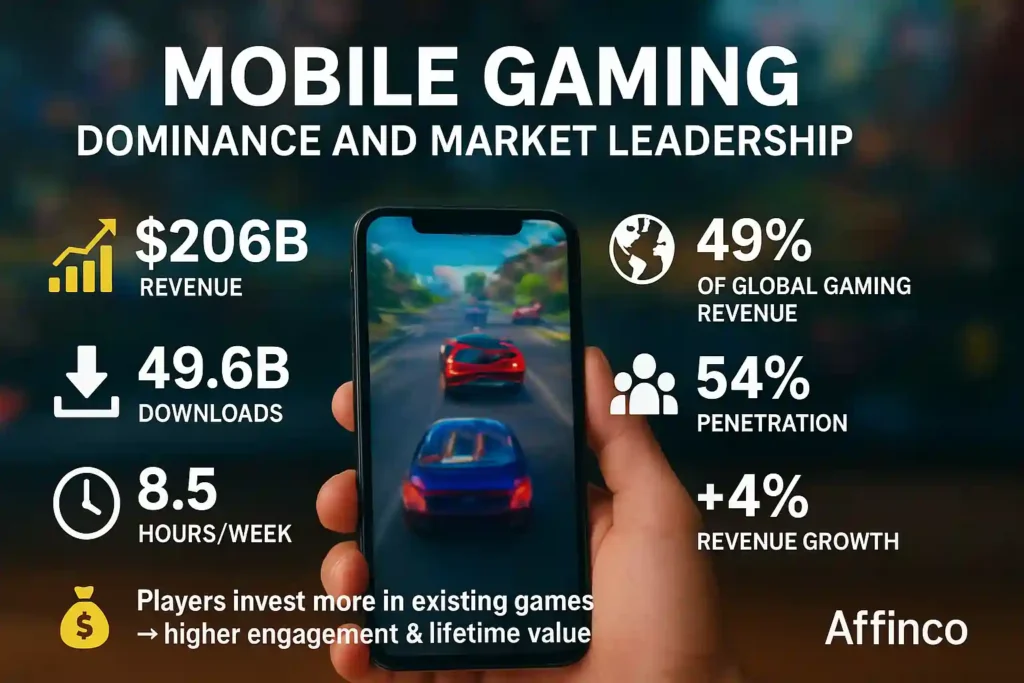
Mobile gaming has established itself as the dominant force within the broader gaming ecosystem. The platform's accessibility and convenience have attracted the largest player base and generated the highest revenue streams.
Mobile gaming statistics for 2025 showcase the platform's continued market leadership and growth potential across global markets.
Key mobile gaming metrics:
Mobile gaming revenue continues growing despite some download decreases, suggesting players are investing more money in existing games rather than constantly acquiring new titles. This trend indicates higher user engagement and lifetime value for successful mobile games.
Top Mobile Games and Performance Metrics
Mobile game statistics for 2025's highest-performing titles demonstrate the concentration of success within the mobile gaming market.
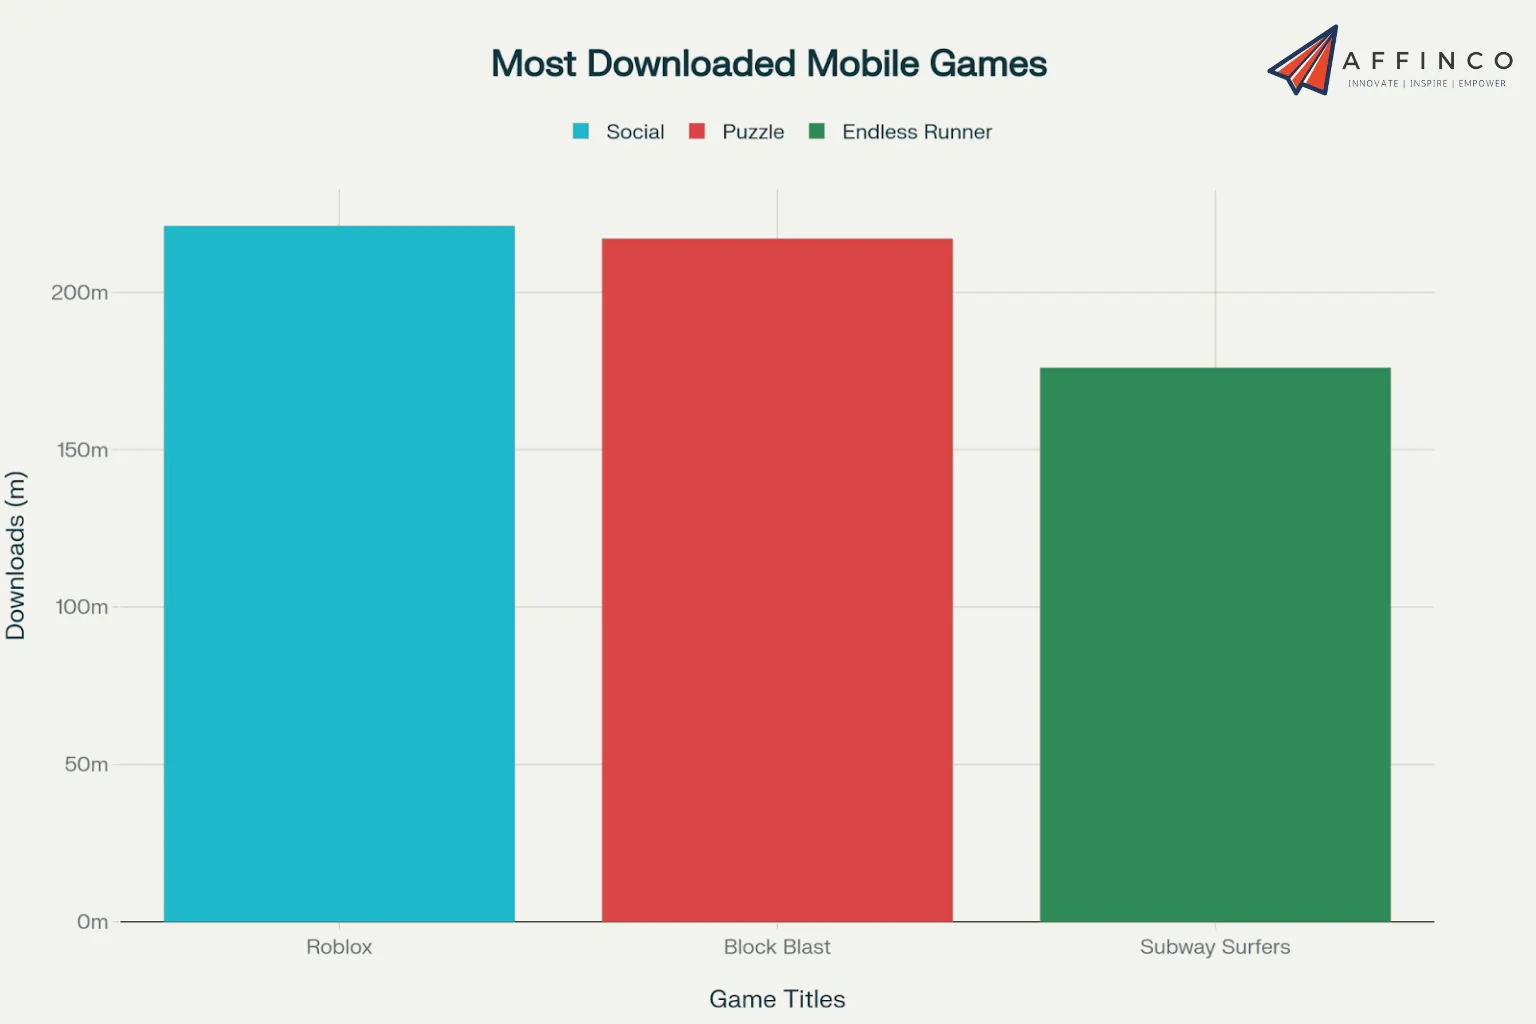
Most Downloaded Mobile Games:
- Roblox: 221 million downloads (social gaming platform)
- Block Blast: 217 million downloads (puzzle game)
- Subway Surfers: 176 million downloads (endless runner)
Highest-Grossing Mobile Games by Revenue:
- Honor of Kings: $2.9 billion annual revenue
- Monopoly GO!: $2.2 billion annual revenue
- Genshin Impact: $2.6 billion annual revenue
- Pokemon GO: $1.9 billion continuing revenue
- Candy Crush Saga: $1.5 billion sustained revenue
- Royal Match: $1.4 billion annual revenue
Leading Mobile Game Publishers by Revenue:
- Tencent: $6.2 billion mobile gaming revenue
- NetEase: $3.8 billion mobile gaming revenue
- Scopely: $2.6 billion mobile gaming revenue
These video game statistics highlight how established franchises and innovative gameplay mechanics can generate substantial revenue streams within the mobile gaming market.
Gaming Genres and Revenue Distribution
Gaming genre statistics reveal fascinating patterns in player preferences and spending behavior across different game categories. While casual games attract more downloads, strategy and RPG games generate higher per-user revenue.
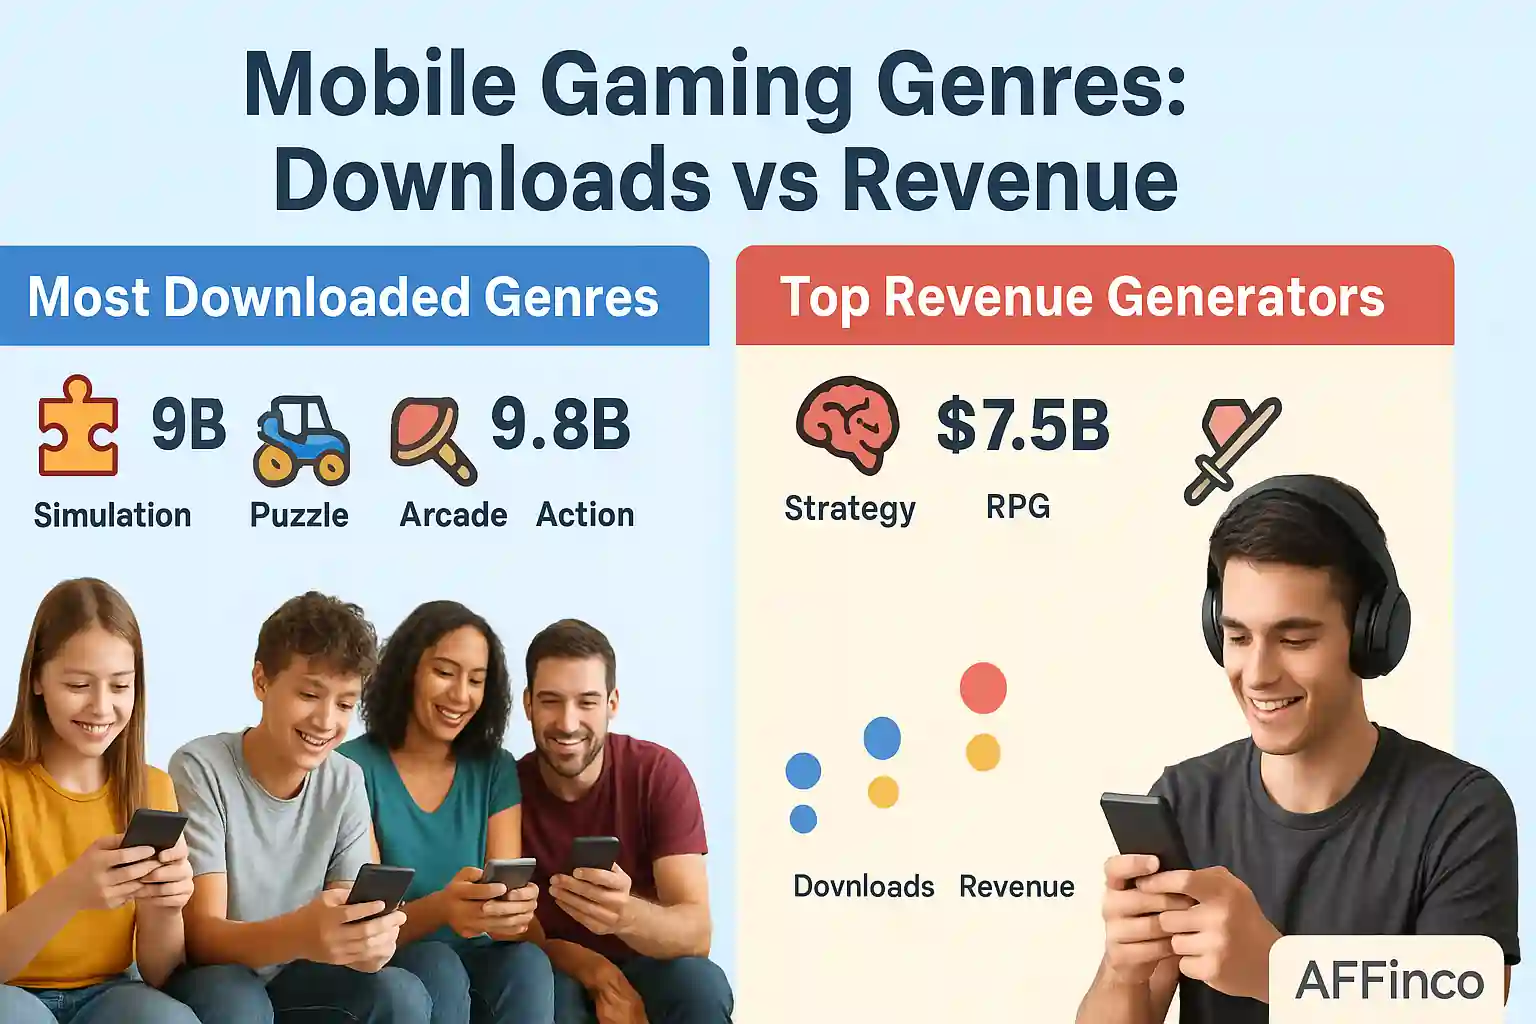
The relationship between download volume and revenue generation shows distinct consumer behavior patterns across gaming genres and platforms.
Most Popular Mobile Game Genres by Downloads:
Top Revenue-Generating Mobile Game Genres:
| Genre Category | Downloads (Billions) | Revenue (Billions) | ARPU |
|---|---|---|---|
| Strategy | 7.2 | $17.5 | $2.43 |
| RPG | 6.8 | $16.8 | $2.47 |
| Puzzle | 9.7 | $12.2 | $1.26 |
| Simulation | 9.8 | $9.6 | $0.98 |
| Arcade | 9.6 | $7.4 | $0.77 |
This disparity between downloads and revenue indicates that casual gaming attracts broader audiences, while core gaming segments generate higher average revenue per user (ARPU) through in-app purchases and premium content.
Gaming Monetization Models and Revenue Streams
Gaming monetization has shifted dramatically toward free-to-play models supported by in-app purchases and advertising revenue. This approach has proven more profitable than traditional one-time purchase models.
In-App Purchase Dominance
Free-to-play monetization relies heavily on optional purchases within games, from cosmetic items to gameplay advantages. This model has become the industry standard for mobile gaming.
Key Monetization Statistics:
- 95% of mobile app revenue comes from in-app purchases
- Average revenue per user (ARPU): $60.58 in the US for 2025
- In-app purchase growth: 4% increase in 2025
Player Attitudes Toward Advertising
Gaming advertising has gained acceptance among players when implemented thoughtfully, with most preferring free games with ads over paid alternatives.
Advertising Acceptance Rates:
- 82% of mobile gamers prefer free games with ads over paid ad-free versions
- 74% of players will watch video ads for in-game rewards
- Gaming ad revenue: $125 billion projected for 2025
Alternative Revenue Models
Direct-to-consumer (D2C) models are gaining traction as companies seek to avoid platform fees and maintain direct customer relationships. Companies like Playtika have successfully moved $667 million in revenue off traditional app stores.
| Monetization Model | Revenue Share | Growth Trend | Player Preference |
|---|---|---|---|
| In-App Purchases | 95% | Stable growth | High acceptance |
| Advertising Revenue | Growing segment | High growth | 82% prefer over paid |
| Subscriptions | $13.1B projected 2025 | 16% growth | Increasing adoption |
These video game industry statistics demonstrate how successful free-to-play models have become, allowing developers to reach broader audiences while generating substantial revenue from engaged players who choose to make purchases or engage with advertising content.
Console Gaming vs PC Gaming Statistics
Console gaming and PC gaming represent the premium segments of the industry, each serving distinct player preferences and gameplay styles.
➡️ Console gaming statistics reveal strong hardware adoption and exclusive content performance. PlayStation 5 has sold 61.7 million units worldwide since launch, while Xbox Series X/S reached 28.3 million units sold globally.
Nintendo Switch maintains its position with 139.36 million units sold lifetime, making it one of the best-selling consoles ever.
➡️ PC gaming market size continues expanding with 1.35 billion PC gamers worldwide in 2025. The PC gaming revenue of $138 billion comes primarily from digital game sales, hardware purchases, and subscription services.
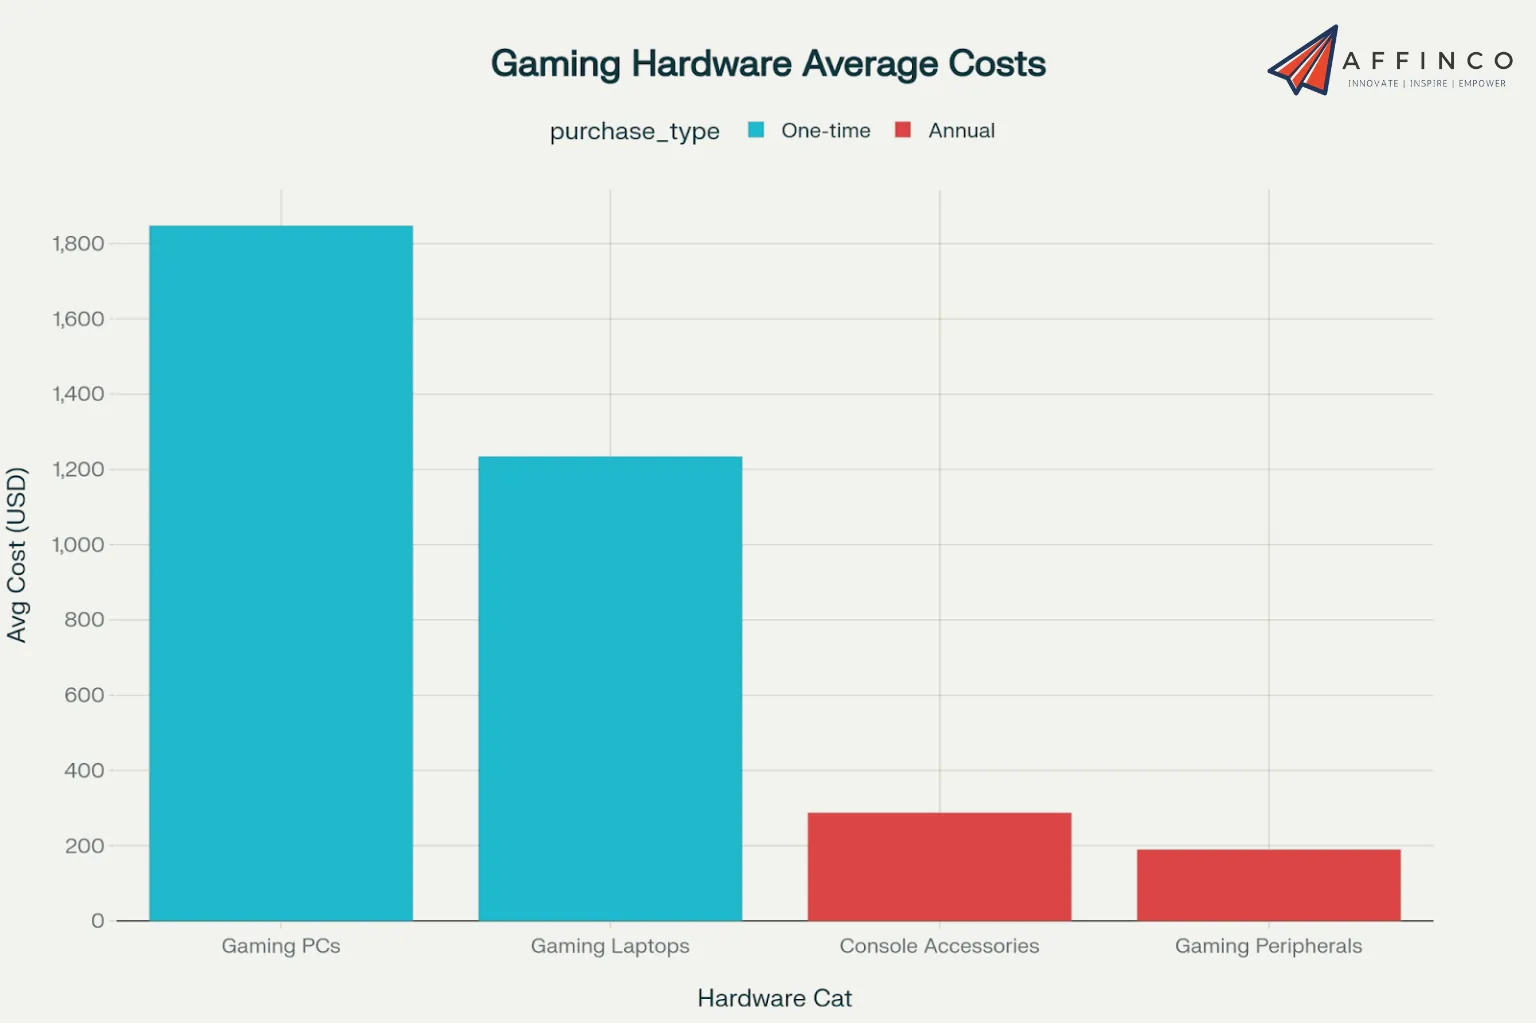
Gaming hardware spending shows significant investment in premium equipment:
Exclusive game performance drives console sales, with The Legend of Zelda: Tears of the Kingdom selling 20.28 million copies and Spider-Man 2 achieving 11 million copies sold in the first six months.
Virtual Reality and Augmented Reality Gaming
VR gaming statistics show steady growth as technology becomes more accessible and content libraries expand. The VR gaming market is valued at $7.8 billion in 2025, with projections reaching $53 billion by 2030.
VR headset sales reached 8.9 million units in 2024, representing 31% growth year-over-year. Meta Quest 3 leads with 42% market share, followed by PlayStation VR2 at 23% market share.
VR gaming engagement metrics demonstrate strong user commitment:
Mobile-first adoption with Pokemon GO maintaining 147 million monthly active users five years after launch. AR gaming revenue reached $4.2 billion in 2024, with location-based AR games accounting for 67% of segment revenue.
Popular VR gaming genres by revenue generation:
Regional Gaming Markets and Geographic Distribution
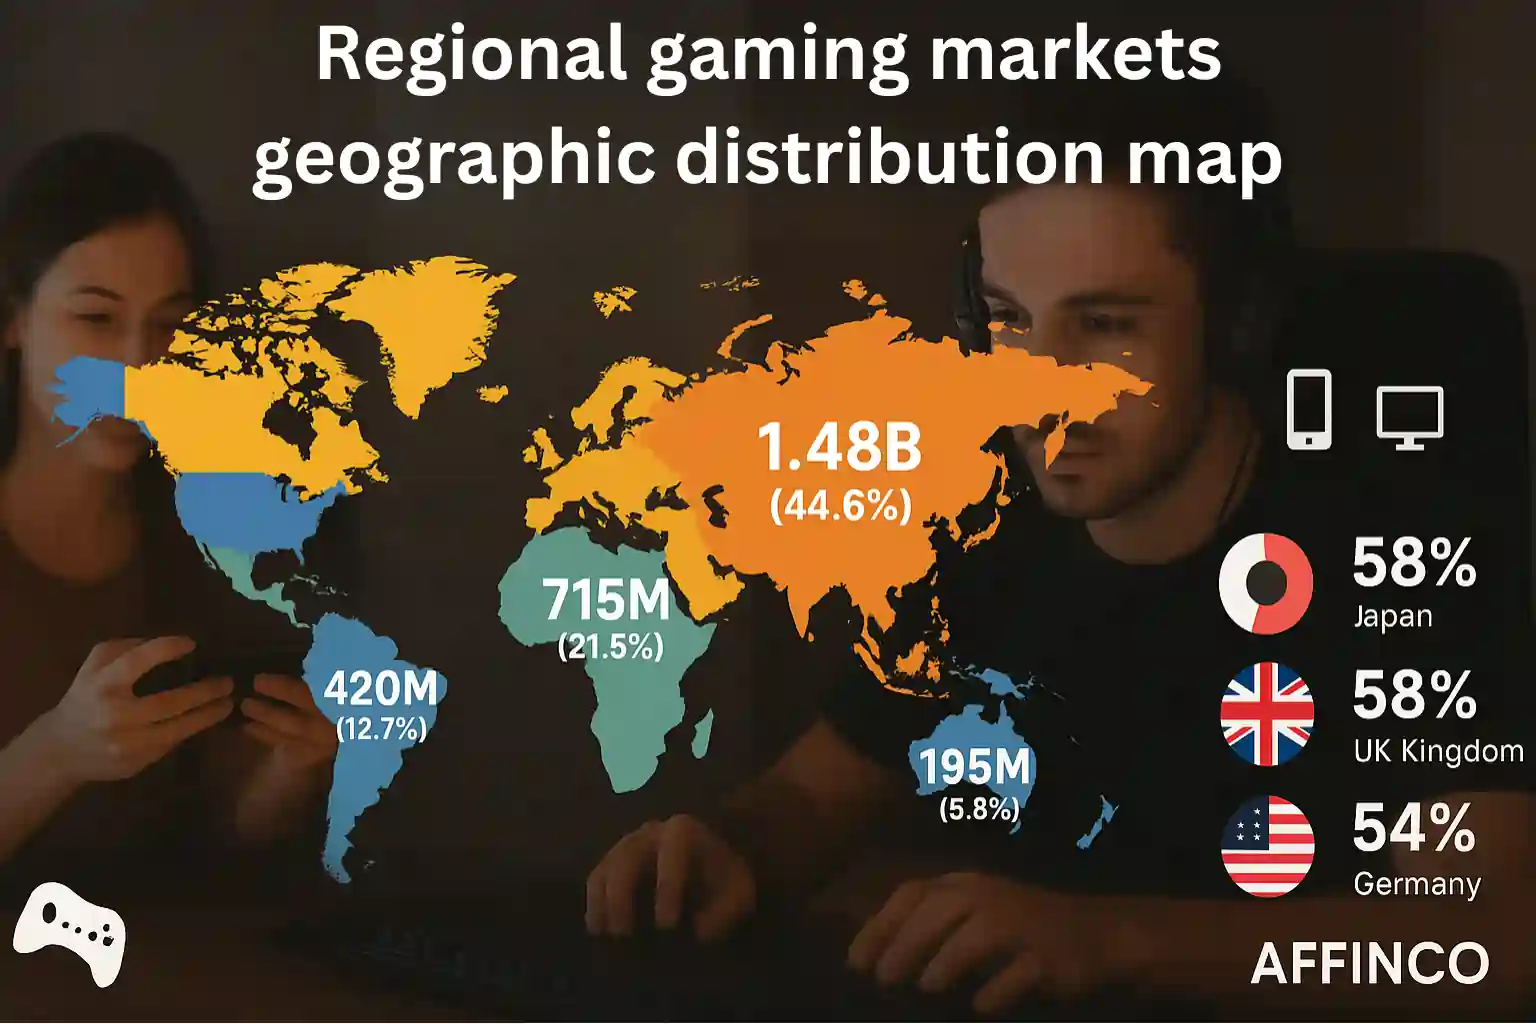
Gaming statistics by region reveal significant variations in player concentration, spending patterns, and platform preferences across global markets. Understanding these regional differences is crucial for industry stakeholders and marketers.
Asia maintains its position as the world's largest gaming market, housing nearly half of all global players and generating substantial revenue across mobile and PC gaming platforms.
Regional gamer distribution:
Gaming penetration rates by country demonstrate varying levels of market saturation and growth potential:
The Asia-Pacific gaming market dominates due to high smartphone penetration, cultural acceptance of gaming, and strong local game development industries in countries like China, Japan, and South Korea.
Player Behavior and Gaming Engagement Patterns
Gaming behavior statistics provide valuable insights into player motivations, session patterns, and engagement preferences across different game types and demographics.
Understanding why people play games helps explain the industry's massive appeal and sustained growth across diverse audience segments.
Primary motivations for gaming:
Gaming session patterns by genre show distinct engagement behaviors across different game categories:
(Puzzle, Arcade):
- Average session length: 7 minutes
- Daily sessions: 5 sessions per day
- Total daily playtime: 35 minutes average
(Card, Board):
- Average session length: 10 minutes
- Daily sessions: 6 sessions per day
- Total daily playtime: 60 minutes average
- Average session length: 8 minutes
- Daily sessions: 4 sessions per day
- Total daily playtime: 32 minutes average
These gaming engagement statistics reveal that classic games generate the highest daily engagement, while casual games are played most frequently throughout the day.
Social Gaming and Multiplayer Statistics
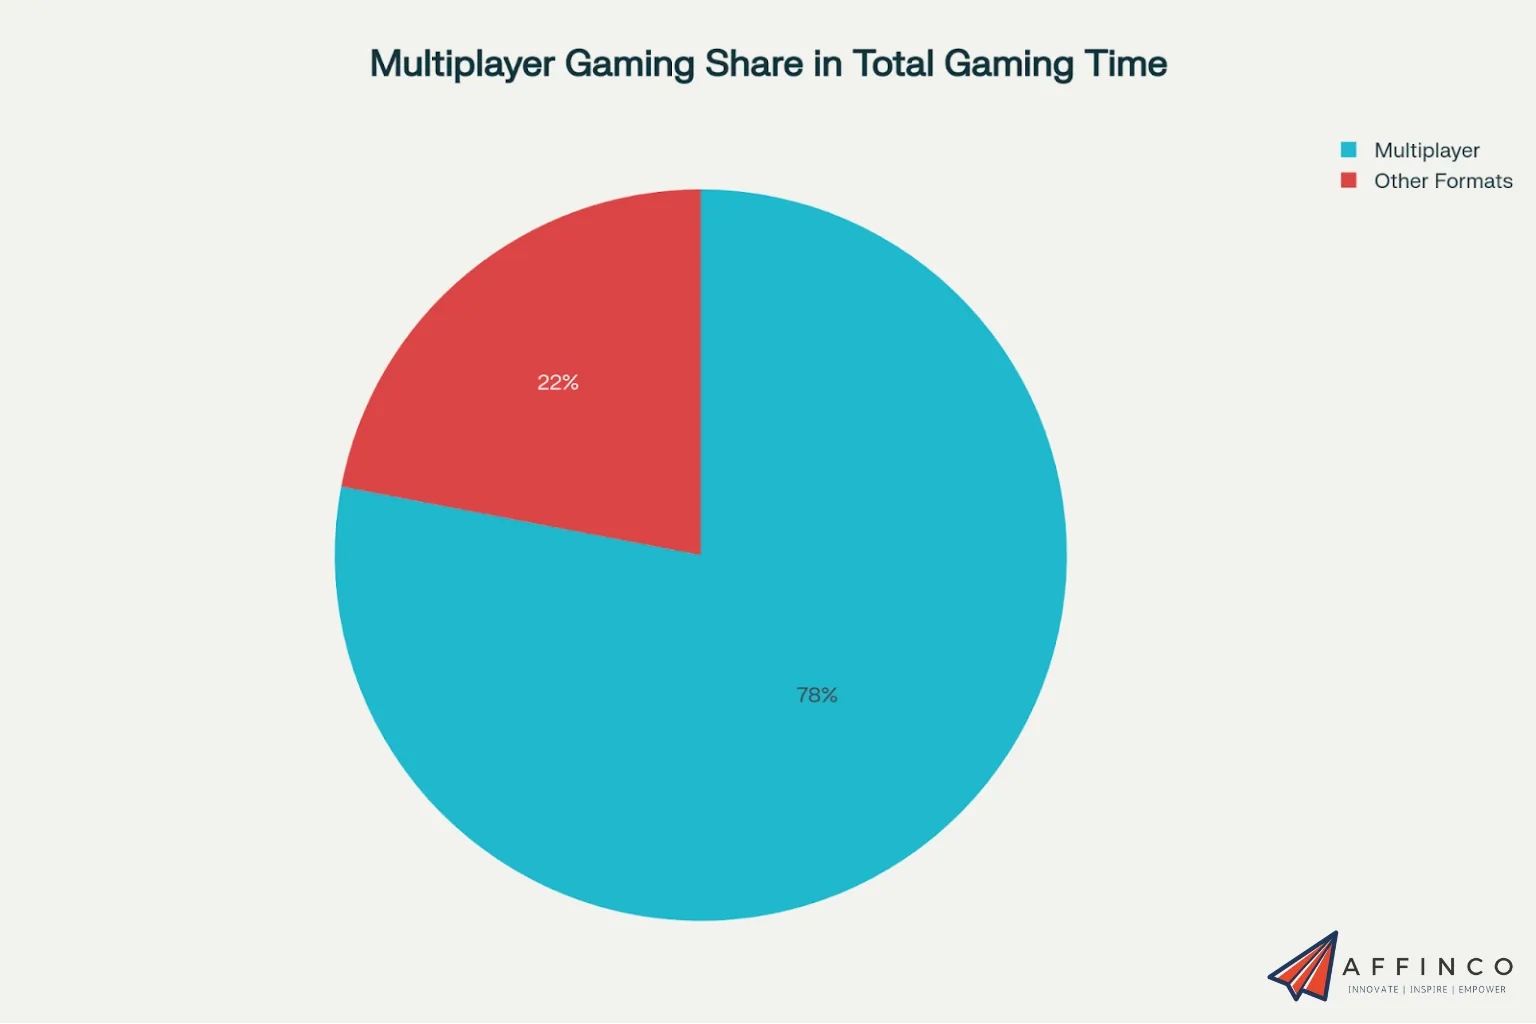
Social gaming has become the dominant form of interactive entertainment, with multiplayer games accounting for 78% of total gaming time across all platforms.
Online multiplayer participation shows massive engagement levels. 2.8 billion players engage in online multiplayer gaming monthly, with average session durations of 47 minutes per multiplayer game. Voice chat usage during gaming sessions reaches 89% of multiplayer participants.
Popular multiplayer gaming platforms demonstrate the social aspect's importance:
| Platform | Active Users | Average Session Time | Monthly Engagement |
|---|---|---|---|
| Discord | 196 million | 142 minutes/day | 89% of gamers |
| Steam | 132 million | 87 minutes/day | 76% of PC gamers |
| PlayStation Network | 123 million | 94 minutes/day | 82% of console gamers |
Cross-platform gaming adoption has reached 67% of multiplayer games, allowing friends to play together regardless of their chosen platform.
Gaming communities on platforms like Reddit and Discord have grown by 34% year-over-year, with gaming subreddits attracting 450 million monthly visitors.sqmagazine
Cooperative gaming preferences show strong social bonds, with 73% of gamers preferring to play with friends rather than solo.
Family gaming accounts for 41% of household gaming time, with parents and children playing together regularly.
Esports and Competitive Gaming Growth
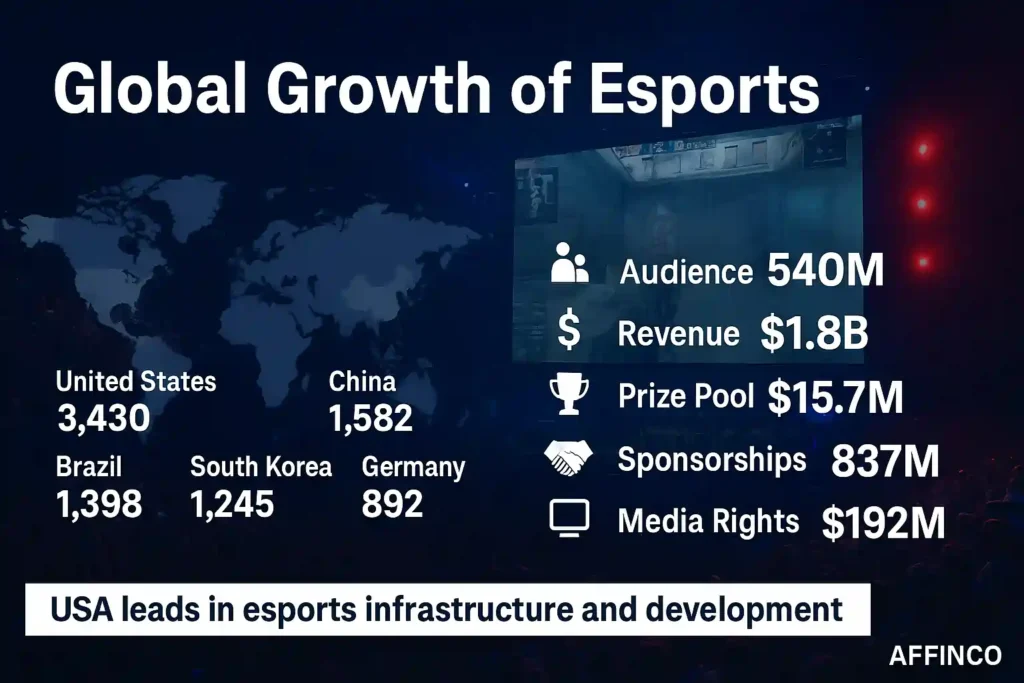
Esports statistics demonstrate the competitive gaming scene's rapid professionalization and growing audience engagement worldwide. The sector has evolved from grassroots tournaments to major sporting events with substantial prize pools and viewership.
The esports industry continues expanding globally, with certain regions leading in player development and competitive infrastructure.
Active esports players by region:
Esports market metrics:
The United States maintains its leadership position in competitive gaming infrastructure, tournament organization, and player development programs.
Gaming Technology Trends and Platform Evolution
Gaming platform statistics illustrate the ongoing evolution of how players access and engage with games across various devices and services.
Current technology adoption patterns show the gaming industry's adaptation to changing consumer preferences and technological capabilities.
Platform usage distribution:
Gaming service subscriptions have gained significant traction:
Cross-platform gaming continues growing in popularity, with players expecting seamless experiences across devices and platforms.
Gaming Addiction and Health Statistics
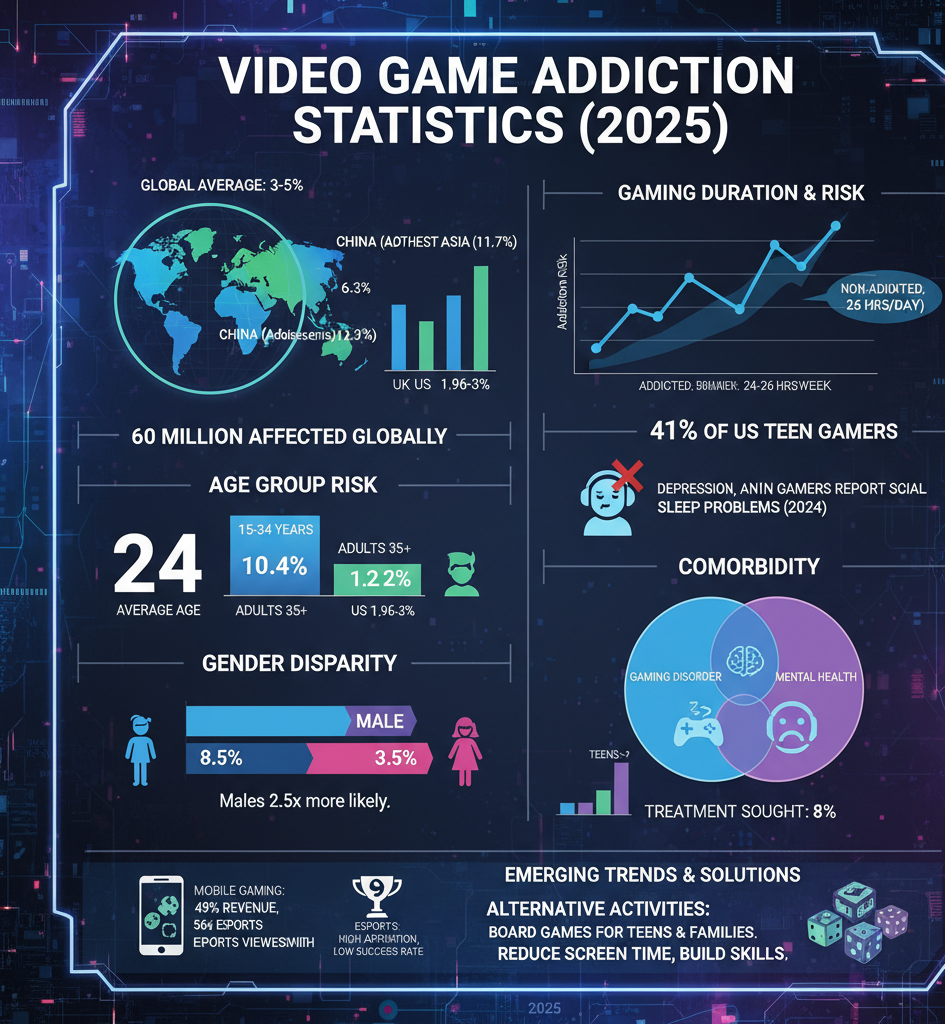
Gaming addiction statistics provide important insights into healthy gaming habits and potential concerns. The World Health Organization recognizes Gaming Disorder, affecting approximately 1-3% of gamers globally.
Excessive gaming behaviors show varying patterns across age groups. Adolescents aged 13-17 spend an average of 3.2 hours daily gaming, while adults aged 18-34 average 2.7 hours daily.
Problem gaming indicators include gaming sessions exceeding 6 hours daily and neglecting responsibilities for gaming activities.
Positive gaming health statistics demonstrate benefits when gaming is balanced:
Gaming wellness initiatives have grown significantly, with 67% of gaming companies implementing responsible gaming features like time limits and break reminders. Parental control usage has increased to 89% of households with children under 16.
Where Gaming Goes From Here
The gaming scene keeps expanding beyond traditional boundaries as 78% of total gaming time now happens in multiplayer modes, and cross-platform support reaches 67% of games.
VR gaming alone sits at $7.8 billion, while the average mobile gamer hits 36 years old – proving games attract serious adult audiences with real spending power.
These shifts show gaming has moved far past simple entertainment into a major social and economic force that connects billions of players worldwide.
What new gaming trends will shape how we play and connect in the coming years?

Ali
Ali is a digital marketing expert with 7+ years of experience in SEO-optimized blogging. Skilled in reviewing SaaS tools, social media marketing, and email campaigns, we craft content that ranks well and engages audiences. Known for providing genuine information, Ali is a reliable source for businesses seeking to boost their online presence effectively.