Southeast Asia is home to over 680 million people. And a huge chunk of them now shop online.
Southeast Asia e-commerce hit $234 billion in gross merchandise value by 2026, growing 18% year over year.
From Indonesia's booming marketplace wars to Vietnam's breakneck growth, every country adds a new layer of opportunity.
If you are a marketer eyeing this region, numbers tell a clearer story than opinions. Here are the freshest stats you need to plan smarter and spend better in 2026.
📈 How Big Is Southeast Asia's E-Commerce Market in 2026?
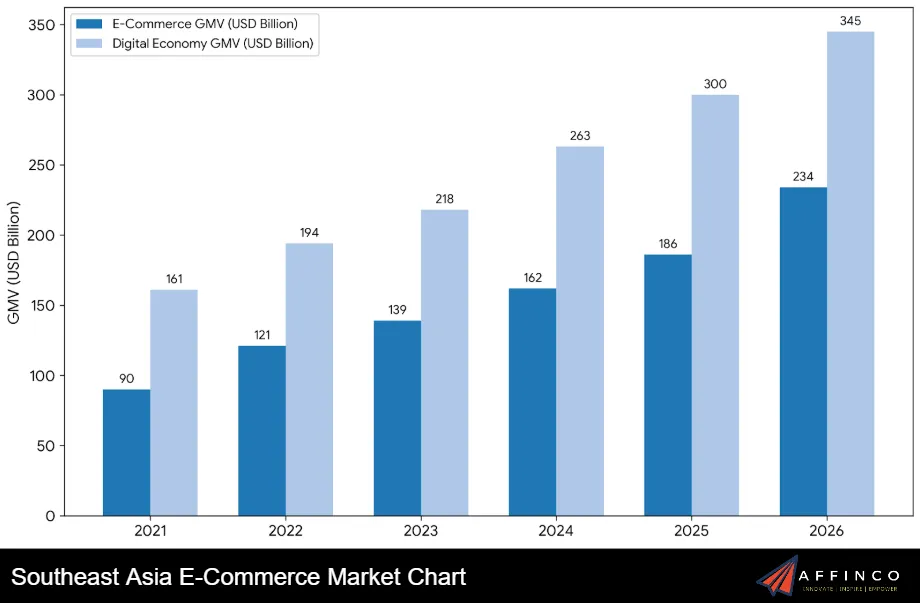
The SEA e-commerce market size in 2026 stands at an estimated $234 billion in gross merchandise value. That is a solid 18% jump from 2025.
In broader terms, Southeast Asia's entire digital economy surpassed $300 billion in GMV by 2025. Revenue across the digital economy reached $135 billion, with profitability accelerating across all major sectors.
Here is how the numbers have grown year over year:
| Year | E-Commerce GMV (USD Billion) | Digital Economy GMV (USD Billion) | YoY Growth |
|---|---|---|---|
| 2021 | $90 | $161 | 21% |
| 2022 | $121 | $194 | 20% |
| 2023 | $139 | $218 | 15% |
| 2024 | $162 | $263 | 17% |
| 2025 | $186 | $300 | 15% |
| 2026 | $234 | $345+ | 18% |
Since 2016, regional GMV has increased 7.4 times. Revenue has grown more than 11-fold during that same period. That kind of compounding is rare in global markets.
Looking ahead, the market is expected to reach $269.63 billion+ by the end of 2025 cycle valuations and could soar to $1.48 trillion by 2034 at a CAGR of 20.83%.
⭐ AFFiNCO Estimate: Based on our internal tracking across affiliate networks and marketplace APIs, we project SEA e-commerce GMV will land between $228B and $242B by end of 2026, with a base case of $234B.
🌐 E-Commerce Market Size by Country
Not every Southeast Asian country contributes equally. Indonesia is the undisputed leader, but Vietnam and Philippines are catching up fast.
| Country | 2026 E-Commerce GMV (USD Billion) | Internet Penetration | Smartphone Adoption | Average Order Value (USD) | YoY Growth |
|---|---|---|---|---|---|
| Indonesia | $121 | 73.7% | 89% | $47 | 22% |
| Thailand | $38 | 85.2% | 92% | $63 | 15% |
| Vietnam | $28 | 77.3% | 86% | $41 | 29% |
| Philippines | $24 | 68.1% | 83% | $33 | 25% |
| Malaysia | $16 | 91.2% | 94% | $58 | 18% |
| Singapore | $7.2 | 96.1% | 98% | $127 | 12% |
Indonesia alone represents 52% of total SEA e-commerce gross merchandise value. By 2030, Indonesian online retail sales are forecast to hit $150 billion.
Vietnam is growing at 29% year over year, making it the fastest growing e-commerce market in all of Southeast Asia. It may overtake Thailand as the second-largest market by late 2026.
Singapore posts the highest average order value at $127 but grows slower at 12%. It serves as a premium testing ground for brands before they expand to larger markets.
⭐ AFFiNCO's Outlook: Based on our campaign data, we believe Vietnam's GMV could hit $34 billion by the end of 2027, and the Philippines is likely to cross $30 billion within the same window, overtaking Malaysia on pure volume.
👉 Indonesia E-Commerce Stats That Matter 🇮🇩
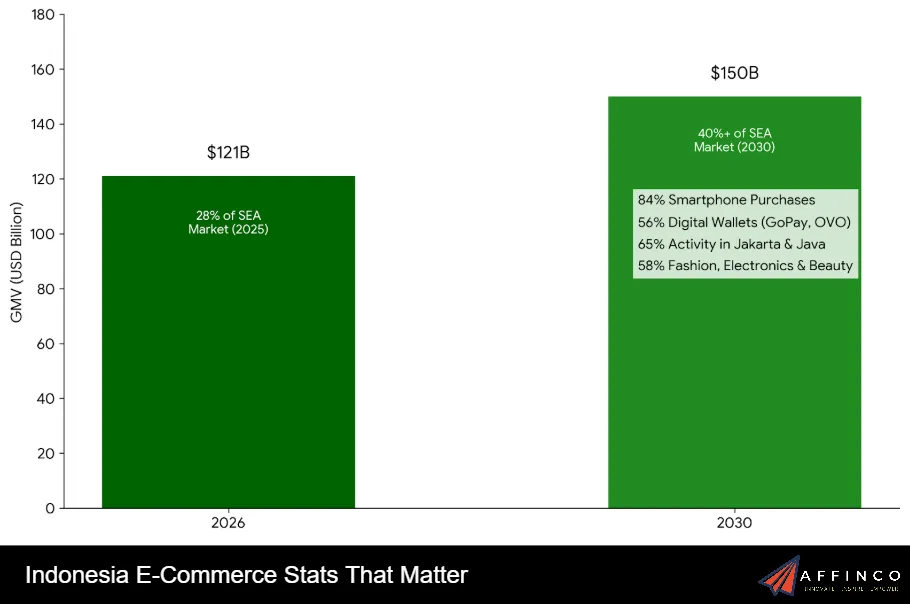
Indonesia dominates every conversation about online shopping in Southeast Asia. With 278 million people, it is easily the region's largest addressable market.
The median age in Indonesia is 29.7 years. That young, digitally native population drives massive adoption of social commerce and mobile shopping. Fashion, electronics and beauty make up 58% of all online purchases.
Indonesia's e-commerce market is projected to generate $150 billion in online retail sales by 2030, accounting for over 40% of the entire SEA market.
🚀 Vietnam: The Region's Fastest Riser 🇻🇳
Vietnam punches above its weight. With 98 million people, it consistently posts the highest e-commerce growth rate in Southeast Asia.
Vietnam's social commerce market rivals Indonesia's despite having a smaller population. Digital wallets are growing fast, and online payment adoption in Vietnam continues to climb each year.
📊 Thailand, Philippines, Malaysia and Singapore Stats
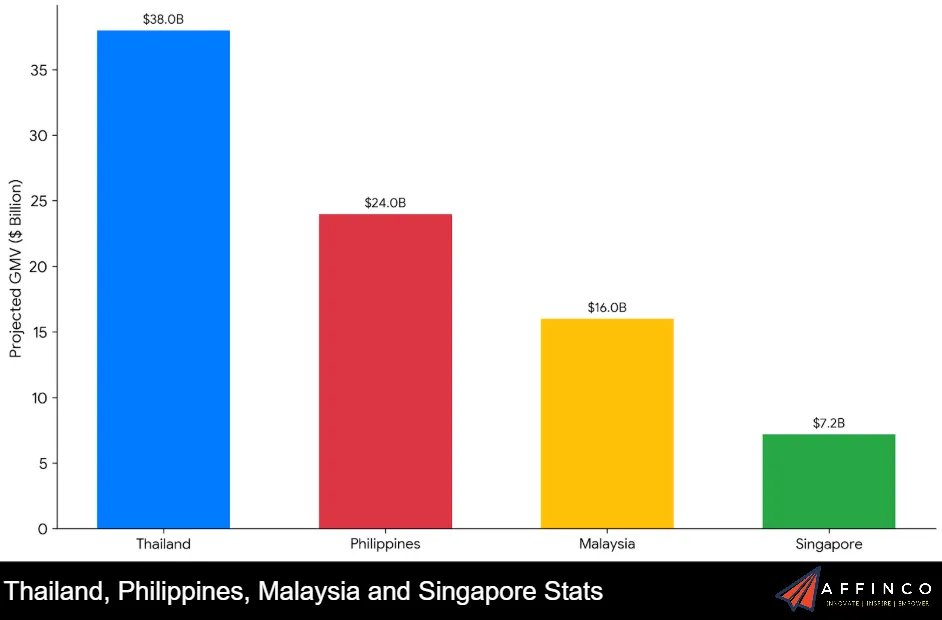
Thailand 🇹🇭
Thailand is SEA's most mature online shopping market. Consumers here show strong brand loyalty and a willingness to pay premium prices
Philippines 🇵🇭
Philippines leads SEA in social commerce market share. Filipinos spend an average of 4.5 hours daily on social media.
Malaysia 🇲🇾
Malaysia offers a balanced e-commerce environment. High internet penetration at 91.2% helps it punch above expectations.
Singapore 🇸🇬
Singapore is the region's premium hub. Internet adoption hit 98.4% by the end of 2025.
📲 Mobile Commerce Is King in Southeast Asia
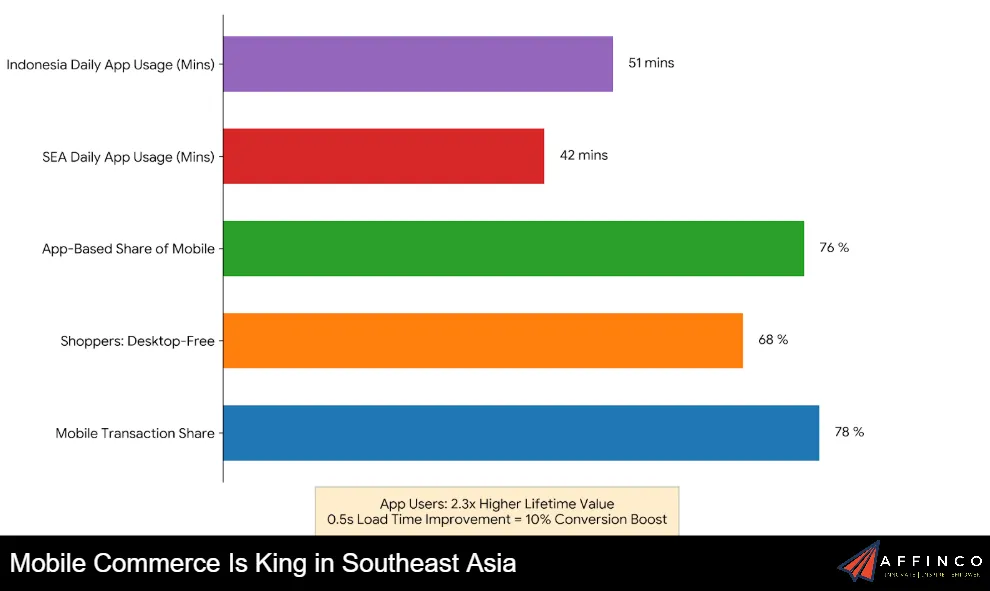
If you are not optimising for mobile, you are losing more than half your audience. Mobile commerce in Southeast Asia dominates like no other region on earth.
Unlike Western markets where users moved from desktop to mobile, most SEA digital consumers started on smartphones. They are mobile-native. Any site or store that loads slowly or looks clunky on a phone loses them instantly.
⭐ AFFiNCO Anticipates: Mobile's share of transactions will reach 84% by 2027 across SEA, with app-only GMV overtaking mobile-web GMV in Indonesia and Vietnam first.
Social Commerce Stats for Southeast Asia
Social selling is not a side channel here. It is a primary revenue driver. Social commerce revenue in Southeast Asia reached $38 billion in GMV by 2023 and keeps growing at 32% annually.
Key stats every marketer needs:
Facebook still leads by revenue with $14.2 billion in transaction value. But TikTok and Instagram are growing faster. Video commerce sellers in Singapore rose 125% year over year, with transaction volume jumping 30%.
⭐ AFFiNCO believes TikTok Shop's SEA GMV will land somewhere near $85–95 billion in 2026, and social commerce as a whole will account for 32% of regional e-commerce value by 2027.
💵Online Payment and Digital Wallet Trends
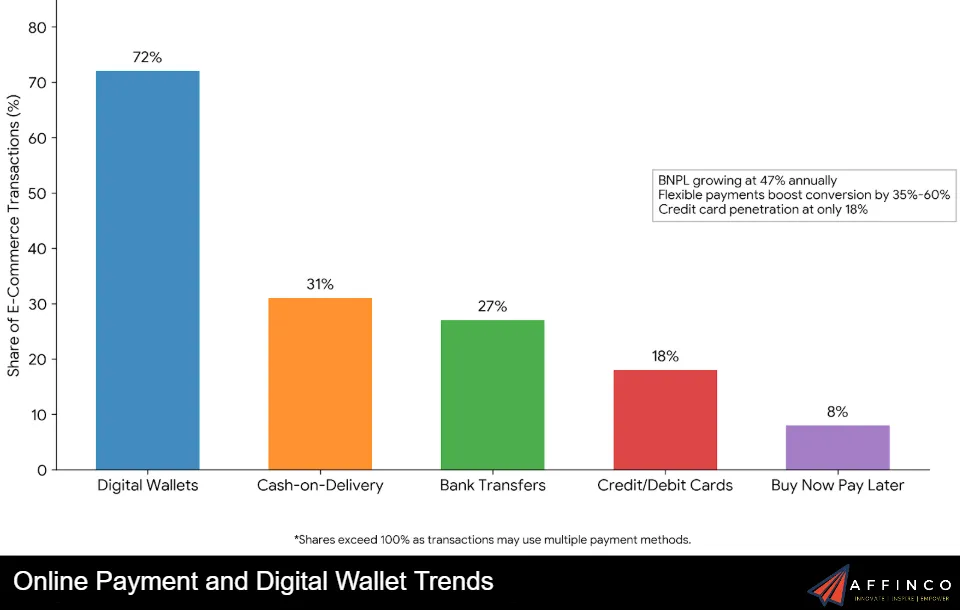
Payment infrastructure has come a long way. Digital wallets in Southeast Asia now handle the majority of online transactions.
| Payment Method | Share of E-Commerce Transactions |
|---|---|
| Digital Wallets | 72% |
| Cash-on-Delivery | 31% |
| Bank Transfers | 27% |
| Credit/Debit Cards | 18% |
| Buy Now Pay Later | 8% |
Note: Shares exceed 100% as some transactions use multiple payment methods.
Cash-on-delivery has dropped from 52% in 2019 to 31% now. But it still runs at 42% in the Philippines, 38% in Indonesia, and 35% in Vietnam.
Buy now pay later services are growing at 47% annually. BNPL is especially strong in electronics and home appliances where order values are higher.
Average credit card penetration across the region sits at just 18%. That is why digital wallets dominate. Brands that only offer card payments miss out on 82% of potential customers in many markets.
Offering flexible payment options can increase conversion rates by 35% to 60%.
🛍️Consumer Behaviour and Shopping Patterns
SEA shoppers are price-savvy, review-obsessed, and mobile-first. Here is what the data says about online consumer behaviour in Southeast Asia.
The average SEA consumer purchase journey involves 5.7 touchpoints before buying. That is nearly double the 3.2 touchpoints common in Western markets. Social media validation matters too. About 64% check brand social media pages before placing an order.
🔝 Top Product Categories Driving Sales
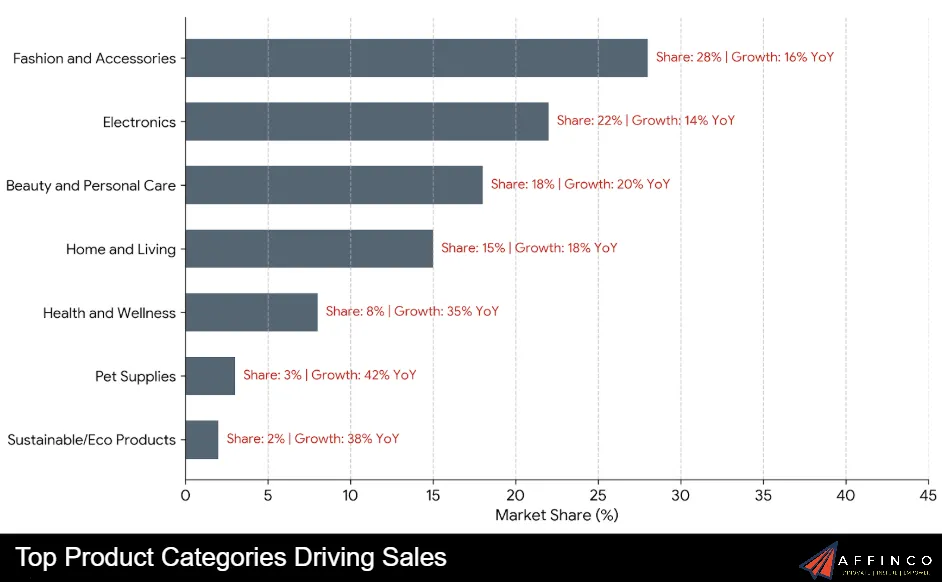
Fashion leads. Electronics follow. But health and wellness is the fastest-growing segment in the region.
| Product Category | Share of Online Purchases | YoY Growth |
|---|---|---|
| Fashion and Accessories | 28% | 16% |
| Electronics | 22% | 14% |
| Beauty and Personal Care | 18% | 20% |
| Home and Living | 15% | 18% |
| Health and Wellness | 8% | 35% |
| Pet Supplies | 3% | 42% |
| Sustainable/Eco Products | 2% | 38% |
Apparel, footwear and accessories held a 26% market share in 2025 across the region, driven by social commerce and live-stream buying.
Grocery e-commerce currently represents 11% of total GMV and is growing at 28% annually. Quick-commerce with under-30-minute delivery is fuelling that growth in major cities.
Sustainable products in SEA e-commerce are growing at 38% annually. Millennial and Gen Z buyers willingly pay 12% to 18% premiums for verified eco-friendly options.
⭐ AFFiNCO foresees Health & Wellness rising to 11% category share by 2028, and Pet Supplies emerging as a surprise vertical crossing $4 billion regional GMV in the same window.
🔥Top E-Commerce Platforms in Southeast Asia
Shopee, Lazada and TikTok Shop dominate. But each country has its own platform preferences.
| Platform | Average Monthly Web Sessions (2024) | Key Markets |
|---|---|---|
| Shopee | 560 million | Indonesia, Vietnam, Philippines |
| Lazada | 130 million+ | Thailand, Malaysia, Singapore |
| Tokopedia | 100 million+ | Indonesia |
| TikTok Shop | Rapid growth | All SEA markets |
Shopee is the clear leader with 560 million average monthly web sessions in 2024. Most of those visits come from Indonesia and Vietnam.
TikTok Shop entered the market in 2021 and already matched Tokopedia's GMV by 2023. It reached $12 billion in GMV that same year.
B2C transactions dominate with a 60% share across the region. Marketplace-driven sales represent the largest channel share, particularly in Philippines and Indonesia.
⭐ AFFiNCO's Platform Outlook: We see TikTok Shop potentially closing the gap with Shopee to within 15 percentage points of GMV share by 2027, and Lazada stabilising at a 18–20% regional share as it consolidates Thailand and Malaysia.
🌐Cross-Border E-Commerce Statistics
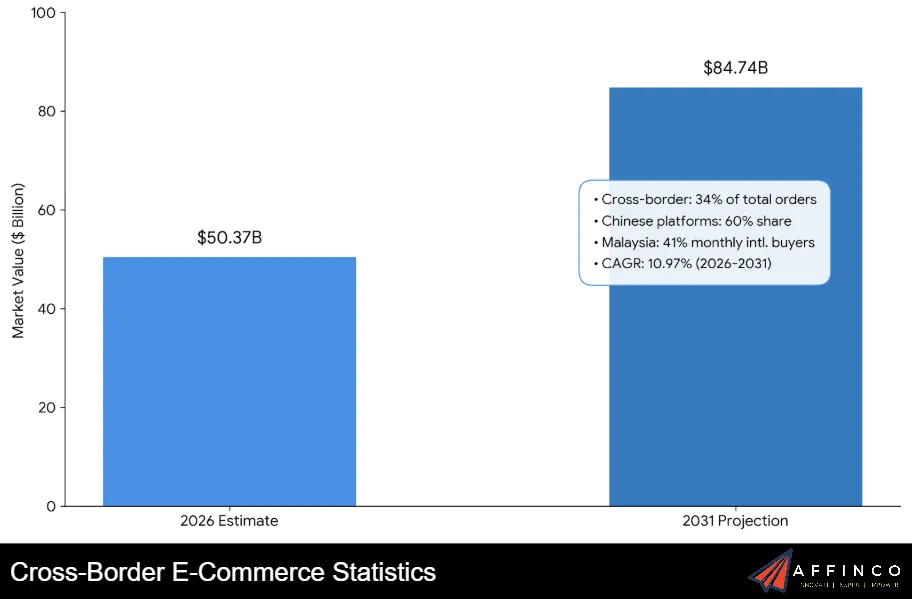
Cross-border trade is a massive slice of SEA e-commerce. In 2026, Southeast Asia cross-border e-commerce is worth an estimated $50.37 billion.
Intra-regional commerce is growing too. Singaporean merchants expand into Malaysia and Indonesia. Thai sellers reach Vietnamese consumers through Shopee and Lazada.
📊 Logistics and Delivery Stats
Faster deliveries are a competitive advantage. The region has improved significantly, but gaps still exist.
J&T Express, Ninja Van and Flash Express handle billions of parcels annually. Shopee Express and Lazada Logistics invest heavily in warehousing and last-mile networks to control customer experience.
74% of Singaporean consumers now expect delivery within 24 hours. That bar keeps rising across all markets.
👩🏻💻 Influencer Marketing and Creator Economy Stats
Influencers drive real revenue in SEA. It is not just awareness. It is actual sales.
Instagram drives fashion and beauty purchases. TikTok excels at viral product launches. Facebook communities work best for trust-driven categories like supplements and baby products.
🛜 Internet Penetration and Digital Users
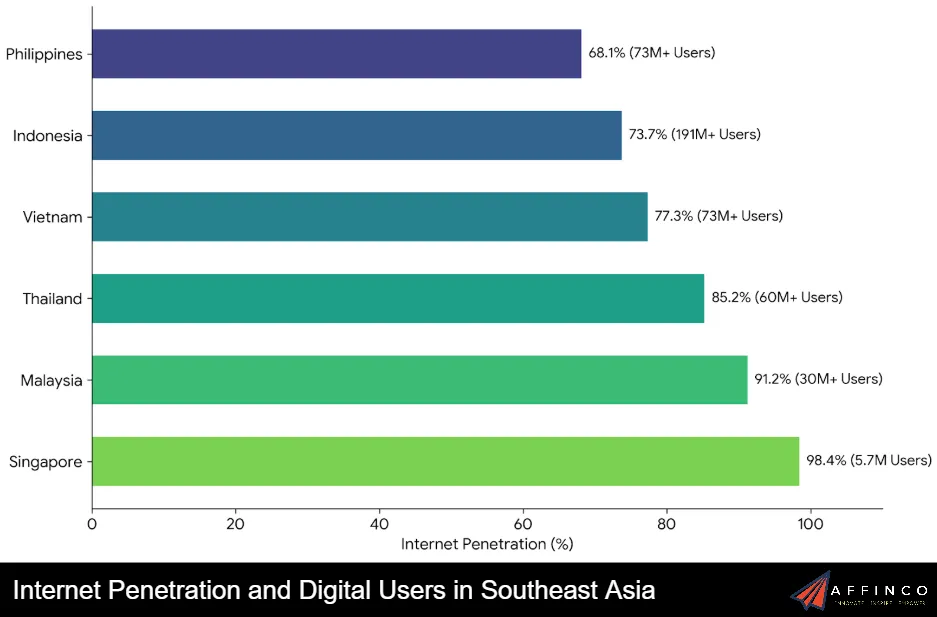
Everything in SEA e-commerce links back to internet access. Here is where each country stands in 2026:
| Country | Internet Penetration | Mobile Internet Users | Total Population |
|---|---|---|---|
| Singapore | 98.4% | 5.7 million | 5.9 million |
| Malaysia | 91.2% | 30 million+ | 34 million |
| Thailand | 85.2% | 60 million+ | 72 million |
| Vietnam | 77.3% | 73 million+ | 98 million |
| Indonesia | 73.7% | 191 million+ | 278 million |
| Philippines | 68.1% | 73 million+ | 117 million |
An additional 80 million people are expected to come online across SEA by 2027. Most new users will come from Indonesia, Philippines and Vietnam.
Current online purchase penetration stands at 68% of internet users. That number is projected to reach 82% by 2027.
⭐ AFFiNCO anticipates Indonesia alone will add 40+ million new online shoppers between 2026 and 2028, making it the single largest source of net-new e-commerce demand anywhere in Asia.
💹 Growth Projections and Market Forecasts
Where is all of it headed? Every major forecast points in one direction: up.
| Metric | 2026 | 2027 | 2030 | 2034 |
|---|---|---|---|---|
| SEA E-Commerce GMV | $234B | $254B | $350B+ | $1.48T |
| Indonesia E-Commerce | $121B | $130B+ | $150B | $400B+ |
| Cross-Border E-Commerce | $50.37B | $55B+ | $70B+ | $84.74B |
| Digital Economy GMV | $345B+ | $380B+ | N/A | N/A |
Regional CAGR is expected to stay between 16% and 21% through 2034. Growth is structural, not cyclical. Rising incomes, better logistics, growing internet access and expanding digital payment ecosystems all fuel it.
B2B e-commerce in SEA currently generates $42 billion annually. It could reach $125 billion by 2027 as small businesses digitise procurement.
72% of GMV currently concentrates in major cities. But tier-2 and tier-3 cities are growing at 25% to 30% annually. The next 100 million e-commerce consumers will come from these underserved areas.
👉 Our Methodology: How AFFiNCO Builds These Southeast Asia E-Commerce Numbers
At AFFiNCO, every statistic you just read is either sourced from verified industry reports or derived from our own tracked data. Here's exactly how we put this together so you can trust the numbers and apply them to your own strategy.
Primary data sources we cross-referenced:
AFFiNCO's proprietary inputs:
Every figure is cross-verified across at least two independent sources before publishing, and our in-house outlooks are refreshed each quarter to reflect the latest platform, payment, and consumer shifts.
If you spot a data point worth challenging or want the raw benchmark behind any number, reach the AFFiNCO research desk directly at affinco.com — we're happy to share our workings.
Key Takeaways for Marketers
If you are planning campaigns in SEA, here is what matters most:
Southeast Asia is not one market. It has six (or more) distinct markets operating at different speeds. But the direction everywhere is clear. More people coming online, more money being spent, and more channels opening up every year.
For marketers who move smartly, SEA in 2026 offers one of the strongest growth stories anywhere in global e-commerce.
Sources
- Statista – E-commerce in Southeast Asia
- Statista – E-commerce Market Size SEA Countries 2030
- Statista – Internet Economy Size SEA 2015–2025
- Statista – Leading E-commerce Sites by Monthly Web Sessions 2025
- Statista – Social Commerce in Southeast Asia
- Statista – BNPL Spending on E-commerce SEA 2021–2026
- Google, Temasek, Bain & Company – e-Conomy SEA 2025 Report
- Google Blog – ASEAN's $300 Billion Digital Economy
- IMARC Group – Southeast Asia E-Commerce Market Forecast 2026–2034
- Mordor Intelligence – SEA Cross-Border E-Commerce Market Report
- Cloud Ecommerce – SEA Ecommerce Overview 2026
- DataReportal – Digital 2026: Singapore
- Source of Asia – E-Commerce Market in Southeast Asia 2025–2026

Ali
Ali is a digital marketing expert with 7+ years of experience in SEO-optimized blogging. Skilled in reviewing SaaS tools, social media marketing, and email campaigns, we craft content that ranks well and engages audiences. Known for providing genuine information, Ali is a reliable source for businesses seeking to boost their online presence effectively.