Airbnb has exploded into a global booking giant, with over 8 million active listings, 150 million users, and billions in annual revenue. These Airbnb Statistics for 2026 pull together the numbers that actually matter if you're a host, investor, or property manager.
From nights booked and host income to occupancy, ADR, and demand by region, this quick snapshot shows where money is really being made on the platform—and whether Airbnb is still worth betting on this year.
Use it as your reference before hosting or expanding into a new market.
Key Airbnb Statistics for 2026
Airbnb Financial Statistics and Revenue Growth
Revenue performance demonstrates Airbnb's financial strength within the hospitality industry and vacation rental sectors. Company earnings reflect post-pandemic recovery and sustained demand for alternative accommodations.
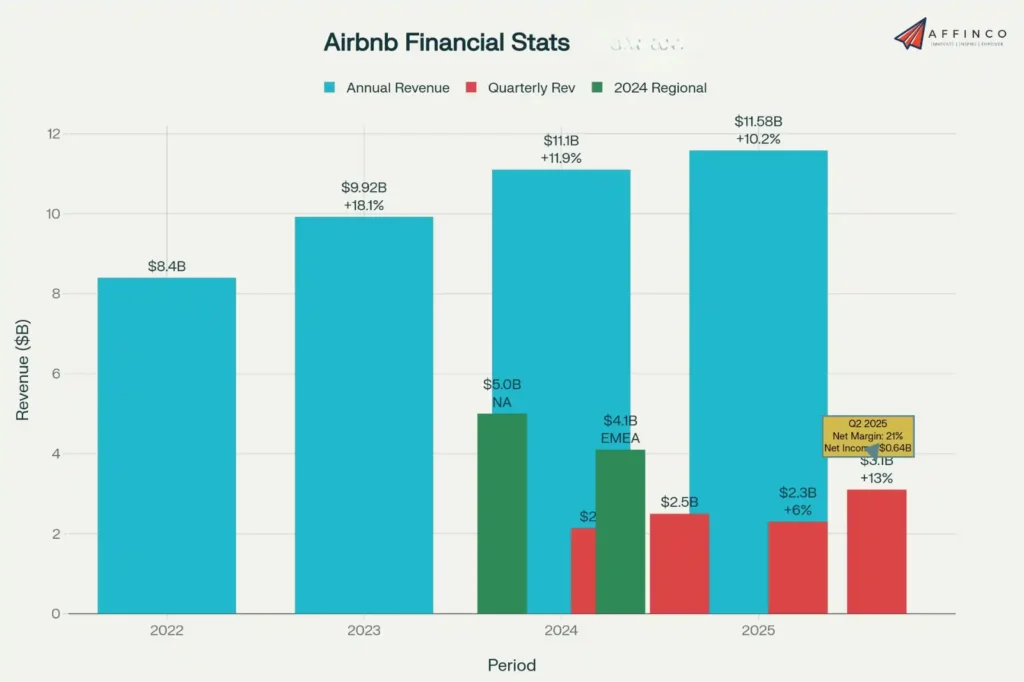
Annual Revenue Growth:
Quarterly Performance Highlights:
| Quarter | Revenue | Year-Over-Year Growth |
|---|---|---|
| Q2 2025 | $3.1 billion | +13% |
| Q1 2025 | $2.3 billion | +6% |
| Q4 2024 | $2.5 billion | Data available |
| Q1 2024 | $2.14 billion | Strong performance |
Revenue from North America dominated at $5 billion in 2024, while the EMEA region contributed $4.1 billion.
The company maintained an impressive 21% net income margin in Q2 2025, earning $642 million profit. Market capitalization stood at $83.3 billion as of December 2024.
For online travel agencies comparison, Airbnb ranks third behind Booking Holdings and Expedia Group but continues gaining market share. Platform's advertising revenue potential is estimated to reach $94 million annually once fully operational.
Airbnb Bookings Statistics: Nights and Experiences
Booking patterns and user behavior provide deep insights into how travelers are using Airbnb. The data reveals trends in stay duration, regional popularity, and overall platform engagement.
In 2024, guests booked over 492 million nights and experiences, an increase from the 448 million in 2023.
These usage statistics highlight how Airbnb is used for everything from quick weekend getaways to extended work-from-anywhere arrangements. The platform's flexibility meets a wide range of modern travel needs.
Stock Performance and Market Capitalization
Airbnb's performance on the stock market reflects investor confidence and its overall financial health. The company's market capitalization is a key measure of its value and position within the industry.

These actions demonstrate the company's strong cash flow and commitment to returning value to shareholders. The stable market capitalization points to a solid position in the competitive travel industry.
Global Airbnb Listings Growth
The number of available listings is the foundation of Airbnb's business model. Continuous growth in listings across different regions and property types ensures a wide selection for travelers.
A growing and varied supply of listings is essential for meeting the needs of a diverse traveler base. The expansion into less traditional areas opens new markets and opportunities for hosts.
Profile of an Airbnb Host in 2026
The success of Airbnb depends on its community of hosts who provide the accommodations. Understanding who these hosts are provides a better picture of the platform's social and economic impact.
There are over 5 million hosts on the Airbnb platform globally.
The fact that most hosts are individuals highlights the platform's role in the sharing economy. It allows everyday people to monetize their extra space and participate in the tourism industry.
Average Host Income and Earnings
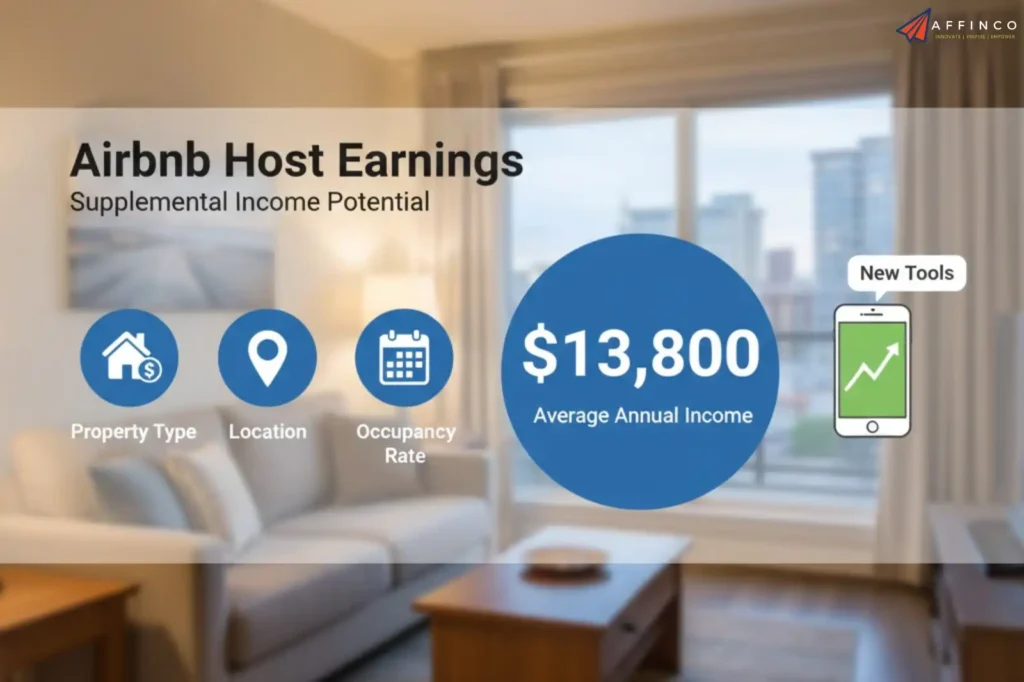
For many, hosting on Airbnb is a way to earn supplemental income. The average earnings provide insight into the financial benefits available to hosts.
This income can be a significant financial support for many individuals and families. The platform continues to be an attractive option for those looking to generate revenue from their property.
Most Booked Listing Types
The types of properties that guests choose reveal accommodation preferences and travel behaviors. This information helps hosts understand market demand and tailor their offerings accordingly.
The preference for private spaces suggests that travelers value privacy and independence. This trend has been particularly strong since the pandemic, as guests seek more control over their environment.
Airbnb User Demographics
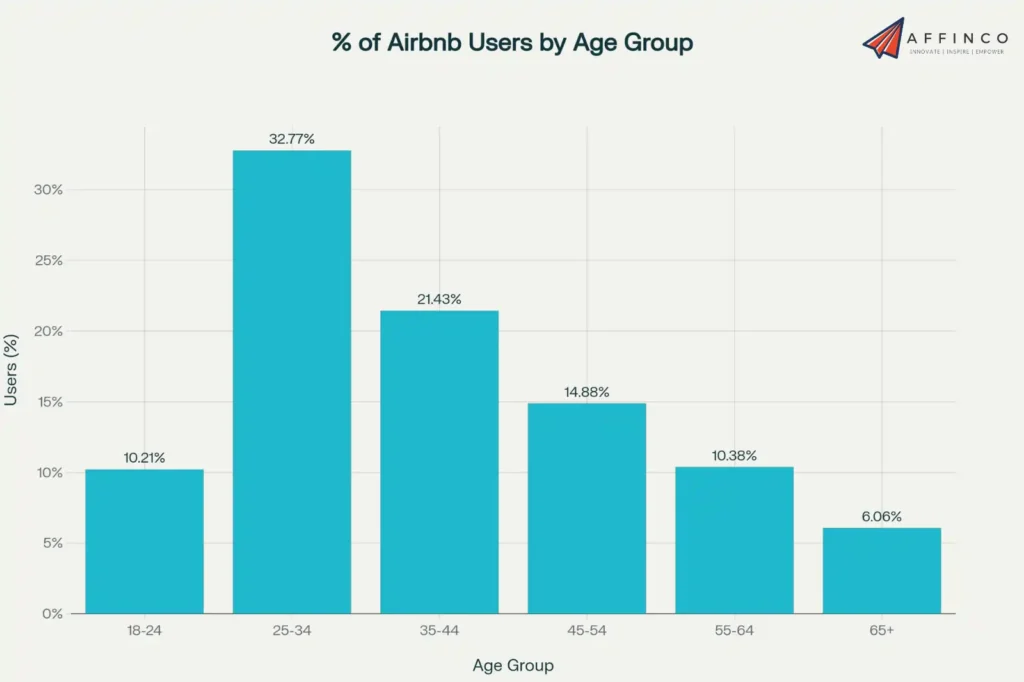
Understanding who uses Airbnb is critical for anyone operating in the travel market. The platform's user base is predominantly young, tech-savvy, and globally distributed.
A significant portion of Airbnb users are Millennials and Gen Z. These generations value experiences and unique accommodations, which aligns well with Airbnb's brand.
| Age Group | Percentage of Users |
|---|---|
| 18–24 years | 10.21% |
| 25–34 years | 32.77% |
| 35–44 years | 21.43% |
| 45–54 years | 14.88% |
| 55–64 years | 10.38% |
| 65+ years | 6.06% |
- The United States remains the largest single market for Airbnb, with a significant number of both domestic and international travelers using the platform.
The demographic data shows that Airbnb's core audience is young adults, but its appeal is broadening to include older travelers and families.
Airbnb User Growth and Reach
The size of Airbnb's user base is a direct measure of its popularity and market penetration. A growing number of users translates to more bookings and greater revenue for the platform and its hosts.
The continuous growth in users, including new bookers, shows the platform's ability to attract new customers. This expanding reach is vital for long-term sustainability and market leadership.
Average Daily Rate (ADR) Analysis
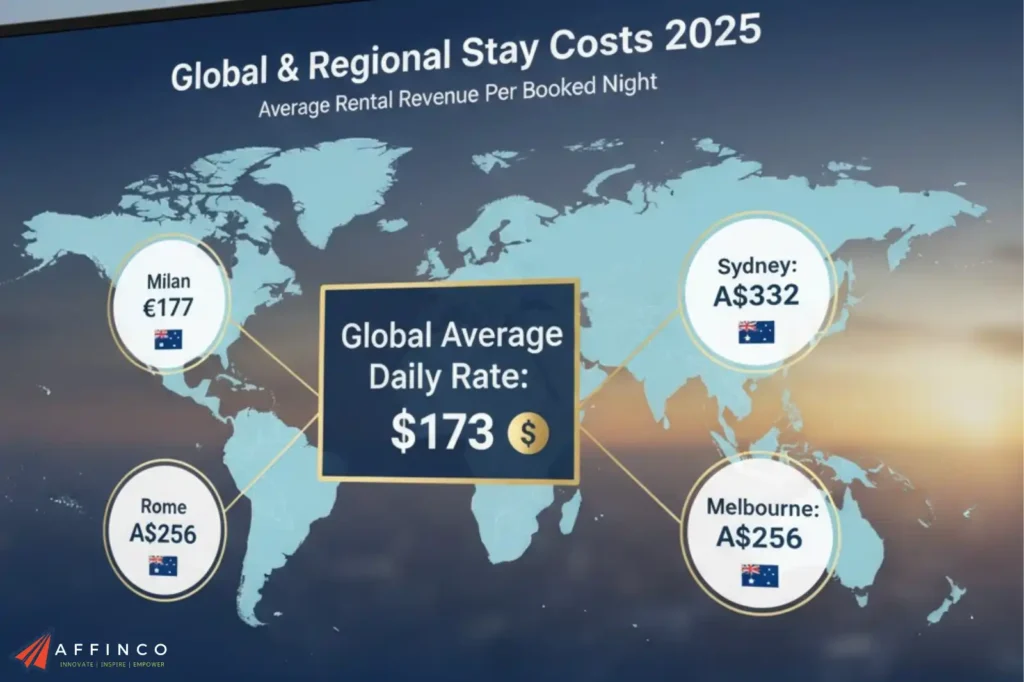
The Average Daily Rate (ADR) measures the average rental revenue per booked night. It is a key indicator of pricing trends and revenue generation for hosts and the platform.
Analyzing ADR helps hosts set competitive prices and forecast potential earnings. Fluctuations in ADR can also reflect broader economic conditions and travel demand.
Gross Booking Value (GBV) Insights
Gross Booking Value represents the total value of all bookings made on the platform. It is a critical indicator of customer spending and platform activity, showing the scale of transactions Airbnb facilitates.
An increasing GBV suggests strong consumer confidence and a growing demand for the types of accommodation and experiences offered on the platform. It reflects the platform's success in attracting and retaining a large and active user base.
Long-Term Stays: An Important Trend
Stays of 28 days or longer have become an important part of Airbnb's business. This trend is driven by the rise of remote work and the “digital nomad” lifestyle.
- In the first quarter of 2024, long-term stays accounted for 17% of all gross nights booked.
- North America has a particularly high rate of long-term stays, with 23% of bookings being for 28 days or more.
- In New York City, regulations have led to an average stay duration of 47 nights in 2026.
The growth in long-term stays presents new opportunities for hosts to secure consistent income. It also shows a shift in how people are using the platform for more than just short vacations.
Geographic Hotspots: Top Cities and Countries for Airbnb
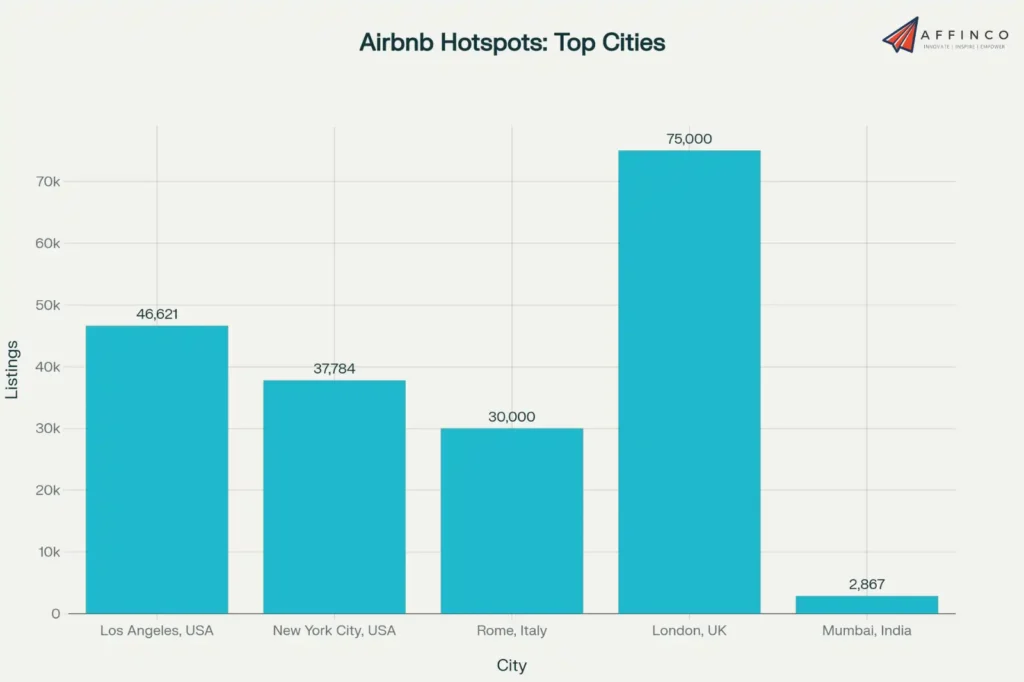
Airbnb's presence is felt worldwide, but certain cities and countries stand out as major hubs for activity. These locations boast a high concentration of listings and a large volume of bookings.
Urban centers remain the most popular destinations for Airbnb guests. However, new regulations in some cities are impacting the types of listings available.
| City | Active Listings (Approx. 2026) | Notes |
|---|---|---|
| Los Angeles, USA | 46,621 | One of the largest markets in the United States. |
| New York City, USA | 37,784 | Dominated by long-term rentals due to city rules. |
| Rome, Italy | 30,000+ | Mostly entire homes or apartments. |
| London, UK | 75,000+ | A top European destination with a vast inventory. |
| Mumbai, India | 2,867 | A growing market with a high occupancy rate of 59%. |
- The United States is home to the largest number of Airbnb listings and users.
- In New York City, regulations have pushed 85% of listings to be for long-term stays, altering the market's character.
While major cities lead in volume, emerging markets in Asia and Latin America are showing the fastest growth rates. This geographic diversification is a strength for the platform.
Impact of AI on the Airbnb Experience
Artificial intelligence is being integrated into Airbnb's operations to improve efficiency and the user experience. This includes customer service and other platform features.
The use of AI can lead to faster response times and more efficient problem-solving for both guests and hosts. It represents a significant investment in technology to enhance the platform's service quality.
Solo Travel Trends on Airbnb
Solo travel is on the rise, and Airbnb is a popular choice for individuals traveling alone. The platform offers a range of accommodation types that are well-suited for solo travelers.
- Solo travelers often seek unique experiences and the opportunity to live like a local, which aligns well with Airbnb's offerings.
- Fall 2026 travel trends show a rise in solo trips, especially among Gen Z travelers.
- Destinations like Paris, New York, and London are popular among solo travelers, but many are also exploring less common locations.
The growth of solo travel provides another market segment for hosts to target. Listings that offer safety, convenience, and opportunities for local immersion are particularly attractive to this group.
The Future of Airbnb: Services and Experiences

In 2026, Airbnb began to expand beyond accommodation with the launch of new offerings. These new business lines aim to capture a larger share of the travel and leisure market.
This expansion signals the company's ambition to become a more complete travel platform. It creates new revenue streams and provides more ways for users to engage with the Airbnb brand.
Final Thoughts on Airbnb Growth
Airbnb continues reshaping how people travel and earn income, with 5 million hosts generating an average of $13,800 annually from alternative accommodations.
Long-term stays now make up 17% of bookings as remote work fuels demand for flexible living arrangements.
From AI-powered customer service reducing support tickets by 15% to new services like private chefs, innovation keeps driving growth in peer-to-peer rentals. Market cap sits at $83.3 billion, proving investors believe in sustainable expansion.
Will you join 90% of hosts who operate as individuals, or keep watching from the sidelines?

Ali
Ali is a digital marketing expert with 7+ years of experience in SEO-optimized blogging. Skilled in reviewing SaaS tools, social media marketing, and email campaigns, we craft content that ranks well and engages audiences. Known for providing genuine information, Ali is a reliable source for businesses seeking to boost their online presence effectively.