
Global digital ad spend is set to cross $781 billion in 2026. Brands are pouring more money into online channels than ever before. For marketers, knowing where every dollar goes is no longer a luxury. It is a necessity. From search advertising and social media to retail media and video, budgets are shifting fast.
If you plan campaigns, manage ad budgets, or run a brand, these digital advertising statistics for 2026 will show you exactly where the money flows. Every number below is backed by current data to help you make smarter decisions this year.
💰 Global Digital Ad Spend Hits Record Numbers in 2026
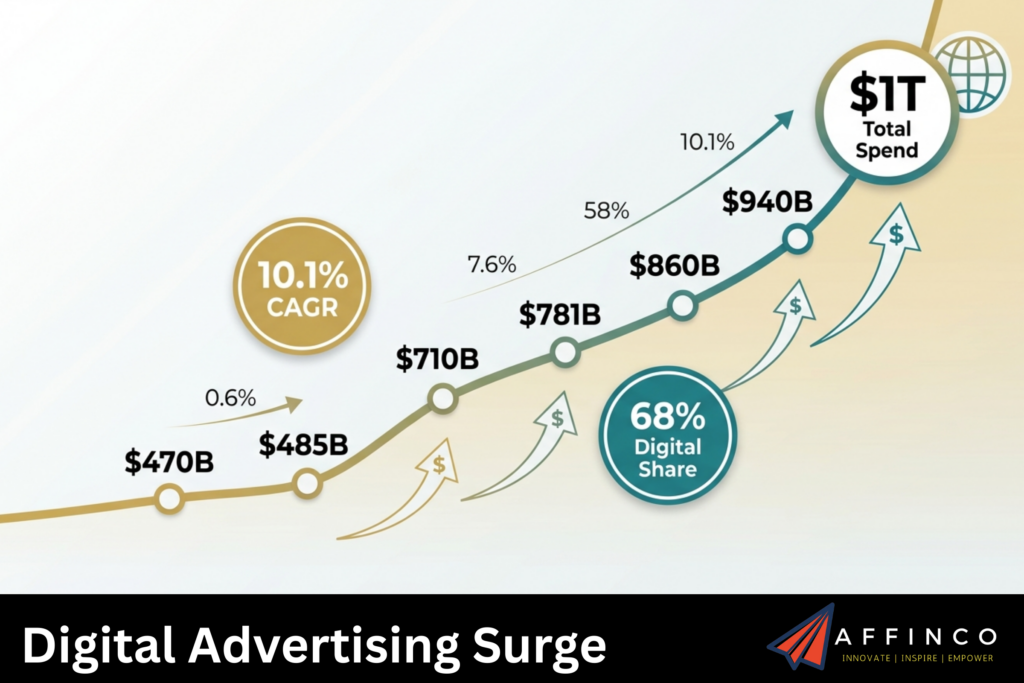
Global advertising spend is forecast to surpass $1 trillion for the first time in 2026. That is a 5.1% increase over 2025, easily outpacing the projected 3.1% growth of the global economy.
Digital advertising alone is expected to reach $781.17 billion in 2026, up from $709.65 billion in 2025. That marks a compound annual growth rate of 10.1%.
Here is how global digital ad spending has grown year by year:
| Year | Global Digital Ad Spend (USD Billion) | Year-on-Year Growth |
|---|---|---|
| 2023 | 470.0 | 9.5% |
| 2024 | 485.0 | 10.3% |
| 2025 | 709.65 | 11.0% |
| 2026 | 781.17 | 10.1% |
| 2027 | 860.0 (projected) | ~10.0% |
| 2028 | 940.0 (projected) | ~9.3% |
Digital channels now account for 68.7% of total advertising investment worldwide. By 2030, the digital ad spending market is expected to hit $1.08 trillion.
🌍 How Much Are Brands Spending on Online Ads Worldwide?
Total advertising and marketing spending hit $1.92 trillion in 2025. Growth is expected to accelerate to 9.8% in 2026, driven by major events like the FIFA World Cup and elections in 40 countries.
A few key stats to understand worldwide ad spend:
Compared to GDP, the UK sees the highest weighted spend on advertising among major economies at 1.65% of total GDP. The United States ranks second at 1.49%.
US Digital Advertising Spending Dominates the Market 🇺🇸
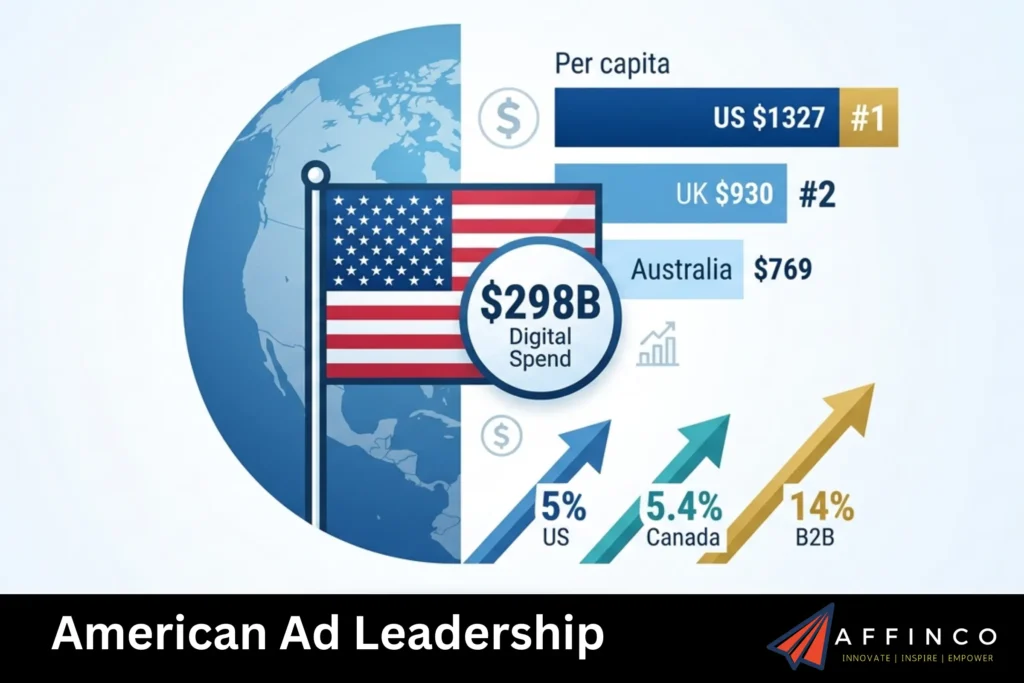
North America remains the largest digital advertising market by revenue. In 2024, digital advertising and marketing in the United States was valued at $298.4 billion.
US ad spend per capita reached $1,327 in 2025, making it the highest in the world. The UK came second at $930 per person, followed by Australia and Switzerland at $769 each.
More US-focused stats:
The US still drives the bulk of global advertising revenue. North America accounted for the largest share of the online advertising market in 2024.
🔍 Search Advertising Remains the Biggest Digital Ad Format
Search advertising is still where marketers spend most of their online advertising budget. It accounts for the single largest share of ad spend, well ahead of online video and traditional TV.
| Ad Format | 2025 Spend (USD Billion) | Growth Rate | 2026 Outlook |
|---|---|---|---|
| Search Advertising | 352 | 11.1% | Largest segment at ~$390B |
| Social Media Ads | 277 | 13.6% | Growing to ~$314B |
| Online Retail Media | 204 | 22.0% | Fastest-growing channel |
| Traditional TV | 146 | Declining share | Losing ground to digital |
| Display Advertising | 740.3 (total) | Steady growth | Largest by broad definition |
Global spend on online search advertising has more than doubled since 2020. In 2026, search advertising is projected to be the largest market with a volume of approximately $390 billion.
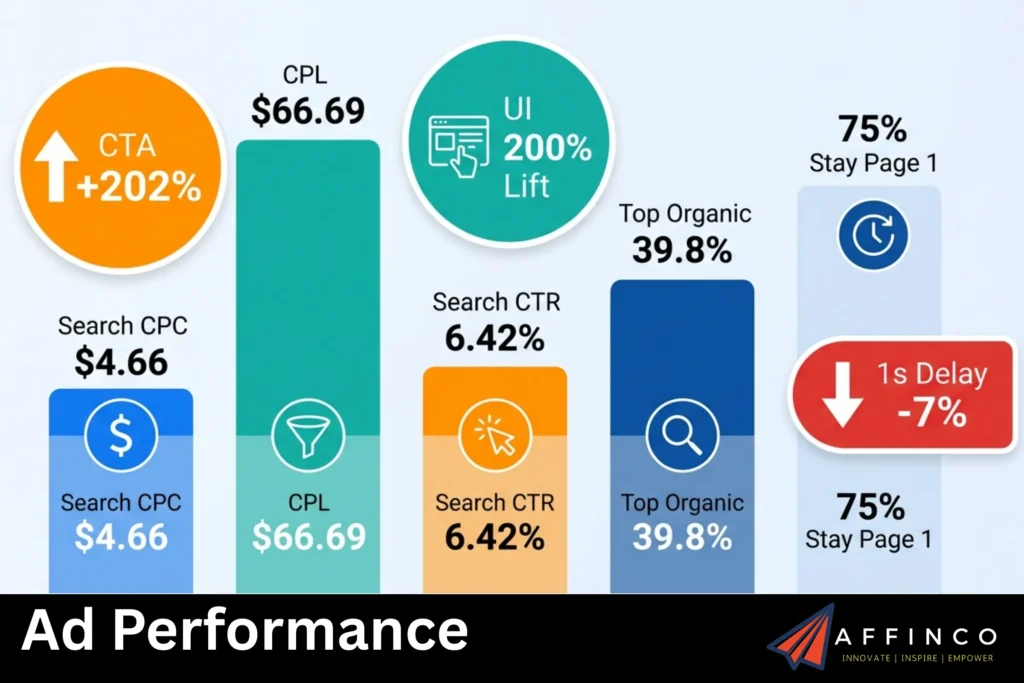
Average cost-per-click for search ads stands at $4.66 across all industries. Average click-through rate for paid ads is 6.42% across all sectors. Research shows that search ads can increase brand awareness by up to 80%.
📱 Social Media Ad Spend Crosses $300 Billion in 2026
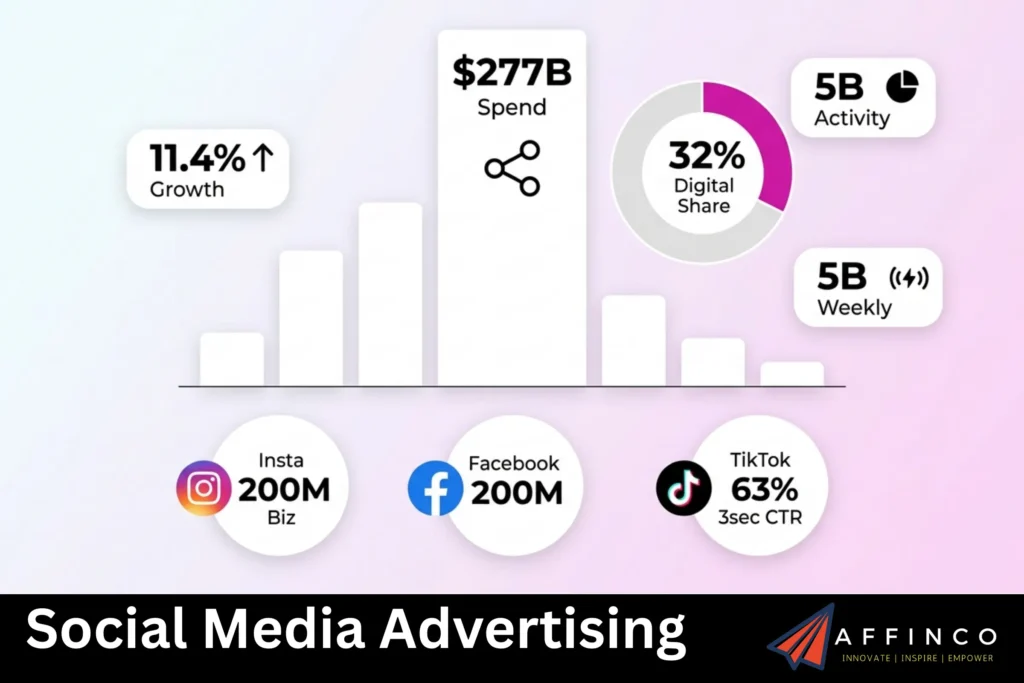
Social media advertising is growing even faster than search. In 2025, worldwide spend on social media ads reached $277 billion, a 13.6% year-on-year increase. That means advertisers spent more than $5 billion per week on social media ads.
Social media ads now account for 32.1% of total digital ad spend. Combined spend across online search and social media equates to roughly 54% of global advertising spend across all channels.
Key social media ad spend numbers:
Platforms like TikTok, Instagram, and YouTube continue pulling budget away from traditional channels. For marketers, social media ad campaigns now represent a must-have line item in every annual budget.
🛒 Retail Media Is the Fastest-Growing Ad Channel
Online retail advertising is surging. Marketers are on track to spend $204 billion on ads on online retail platforms in 2025, which is considerably more than the $146 billion spent on traditional TV.
Retail media is the fastest-growing digital channel, with 14.1% growth projected in 2026. Spending on online retail advertising saw year-on-year growth of 22% in 2025.
Why retail media is booming:
Amazon, Walmart, and other major retailers are building out their advertising platforms to complete directly with Google and Meta for ad dollars. For brands selling physical products, retail media is quickly becoming the most efficient channel for return on ad spend.
🎬 Video Advertising Keeps Growing Strong
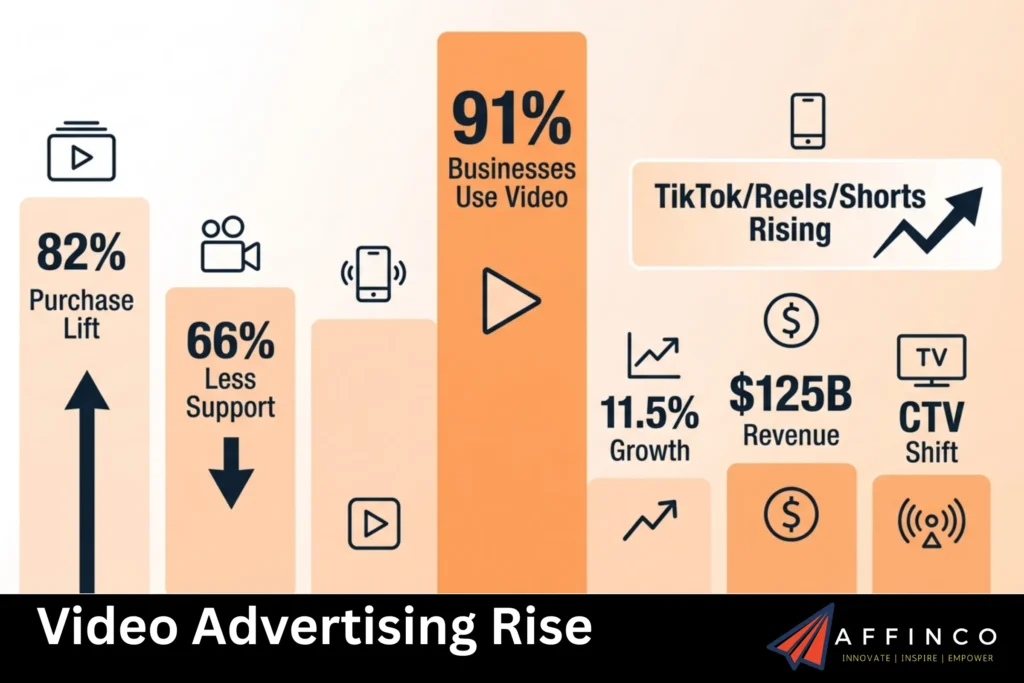
Video is the second-fastest-growing ad format in 2026. Online video advertising is projected to grow by 11.5% this year.
In 2024, video advertising accounted for $124.99 billion in revenue globally. TV and video advertising combined remains the largest segment, with an estimated market volume of $353.91 billion.
Important video ad spend stats:
Short-form video on TikTok, Instagram Reels, and YouTube Shorts is attracting a growing share of video advertising budgets. Brands investing in video content see higher engagement and better conversion rates than static display ads.
📲 Mobile Advertising Now Controls Most Ad Budgets
Mobile is no longer a secondary channel. It is where most digital advertising dollars are spent. In 2024, mobile advertising spending was estimated at $399.6 billion worldwide.
More mobile ad stats for 2026:
A mobile-first advertising strategy is essential in 2026. Marketers who still design campaigns for desktop first are losing reach and conversions every single day.
🤖 Programmatic Advertising Powers Over 80% of Digital Spend

Programmatic advertising is expected to account for more than four-fifths of all digital investment in 2026. That means the vast majority of digital ad buying now happens through automated, algorithm-driven systems.
| Programmatic Metric | 2026 Stat |
|---|---|
| Share of digital ad investment | 80%+ |
| Top channel by programmatic spend | Display and video |
| Fastest-growing programmatic format | Connected TV (CTV) |
| Key driver | AI-powered ad targeting |
Growth in programmatic ad buying is driven by AI-powered targeting, real-time bidding, and cross-platform campaign optimisation. Connected TV is emerging as a major new frontier for programmatic, especially in North America and Europe.
For marketers, understanding programmatic advertising platforms is no longer optional. Brands that rely on manual ad buying are falling behind in efficiency and cost control.
🏢 B2B Digital Ad Spend Stays in Double-Digit Growth
B2B digital advertising is growing rapidly. Globally, B2B digital ad spending increased by roughly 13% in 2025. Growth rates are expected to remain in double digits in 2026.
In the United States, B2B digital ad spending grew by 14% in 2025. That outpaced the global average, reflecting how US B2B brands are shifting budgets from events and print to online advertising channels.
Key observations for B2B marketers:
B2B brands are investing heavily in search, LinkedIn ads, and content marketing. As buying cycles get longer, touchpoints across digital advertising channels matter more than ever.
📺Regional Breakdown of Digital Ad Spend in 2026
Ad spend growth varies significantly across regions. Here is how major markets are performing in 2026:
| Region | 2026 Growth Rate | Key Market Highlights |
|---|---|---|
| Americas | 5.2% | US at 5.0%, Brazil at 9.1% |
| Asia Pacific | 5.4% | India at 8.6%, China at 6.1% |
| EMEA | 4.2% | UK at 5.7%, leading the region |
| Latin America | 9.1% (Brazil) | Fastest major market growth |
| North America | Largest market | Highest per capita spend |
Asia Pacific is the fastest-growing region for digital advertising investment. India is expected to register the highest CAGR from 2025 to 2030. China continues to be a major contributor, with its massive e-commerce ecosystem driving retail media ad spend.
Emerging markets in South Asia, Latin America, and Africa are showing the strongest growth potential. Lower CPCs and rising internet penetration make these regions attractive for brands looking to expand global ad campaigns.
📈 Key Ad Formats and Their Performance Metrics
Not all ad formats perform equally. Here is a breakdown of how different formats compare on key metrics:
A one-second delay in site speed can reduce conversion rates by 7%. For marketers running pay-per-click campaigns, optimising landing page speed and user experience is just as important as ad creative.
✉️ Email and Content Marketing Still Deliver Massive ROI
While most attention goes to paid channels, email marketing ROI remains unmatched. For every $1 spent on email marketing, brands earn $36 to $45 in return. That is a 3,600% to 4,500% ROI.
More email and content stats:
For brands investing in digital advertising, combining paid ads with strong email marketing and content strategies creates a multiplier effect. Owned channels reduce dependence on rising ad costs and algorithm changes.
What These Numbers Tell Every Marketer About 2026
Every stat in this breakdown points to a clear shift. Digital ad spend now dominates total advertising budgets worldwide. Search, social, and retail media are the three biggest winners. Video and mobile continue to pull spend away from traditional channels.
Programmatic advertising is automating how budgets get allocated. AI is making targeting more precise and campaigns more efficient. Regions like Asia Pacific and Latin America are growing fastest, offering new opportunities for brands willing to go global. For any marketer planning budgets in 2026, the message is simple.
Go digital, go mobile, and go where your audience already spends time. Put money into search, social, and retail media. Track everything with programmatic tools. And never ignore email, because it still delivers the highest ROI of any digital marketing channel.

Ali
Ali is a digital marketing expert with 7+ years of experience in SEO-optimized blogging. Skilled in reviewing SaaS tools, social media marketing, and email campaigns, we craft content that ranks well and engages audiences. Known for providing genuine information, Ali is a reliable source for businesses seeking to boost their online presence effectively.